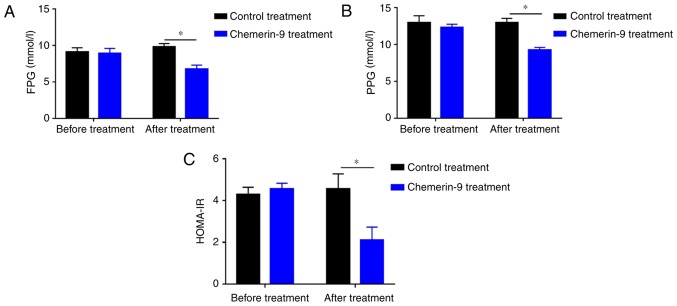
Figure 5.
Effect of chemerin-9 treatment on FPG, PPG, and HOMA-IR in PDM model mice. Levels of (A) FPG and (B) PPG were measured by ELISA in the chemerin-9 and control treatment groups before and after 42 days of treatment. (C) HOMA-IR was measured in the chemerin-9 and control treatment before and after treatment. *P<0.05. HOMA-IR, homeostatic model assessment for insulin resistance; FPG, fasting plasma glucose; PPG, postprandial plasma glucose; PDM, pancreatogenic diabetes mellitus.

