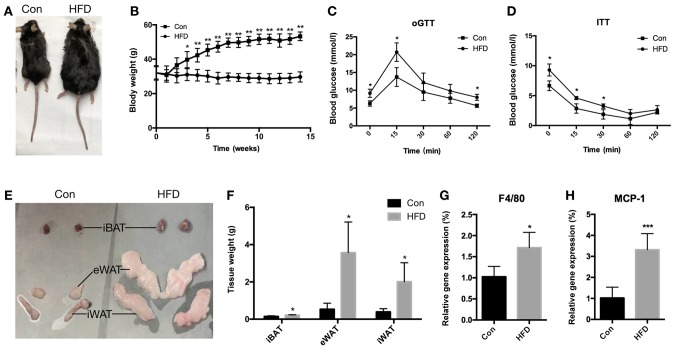
Figure 1.
Characteristics of middle-aged (12-month-old) female C57BL/6 mice fed an HFD for 14-weeks. (A) Representative appearance of Con and HFD mice. (B) Body weights were determined weekly. (C) oGTT and (D) ITT results. (E) Representative images of iBAT, eWAT and iWAT. (F) Tissue weight of iBAT, eWAT and iWAT from the two mouse groups. mRNA expression levels of (G) F4/80 and (H) MCP-1 inflammation-associated genes in eWAT. Data are presented as the mean ± standard deviation. *P<0.05, **P<0.01 and ***P<0.001, vs. Con group. HFD, high-fat diet; Con, control; oGTT, oral glucose tolerance test; ITT, insulin tolerance test; iBAT, interscapular brown adipose tissue; eWAT, epididymal white adipose tissue; iWAT, inguinal white adipose tissue.

