Figure 8.
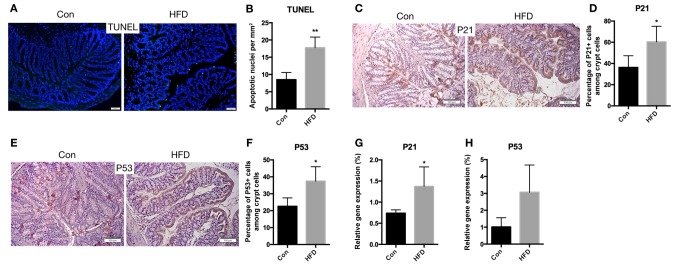
Increased apoptosis in the colon of HFD-fed mice. (A) Colon sections were stained for apoptotic cells using TUNEL assay (scale bar, 50 µm; magnification, ×40), and (B) the quantified number of apoptotic cells is shown. (C) Immunohistochemical staining for P21 expression in the colon (scale bars, 100 µm; magnification, ×40), and (D) quantified percentage of P21-positive crypt cells. (E) Representative images of immunohistochemical staining for P53 (scale bars, 100 µm; magnification, ×40), and (F) quantified percentage of P53-positive crypt cells. (G) P21 and (H) P53 mRNA expression levels in the colon. Data are presented as the mean ± standard deviation. *P<0.05 and **P<0.01, vs. Con group. HFD, high-fat diet; Con, control.

