Figure 1.

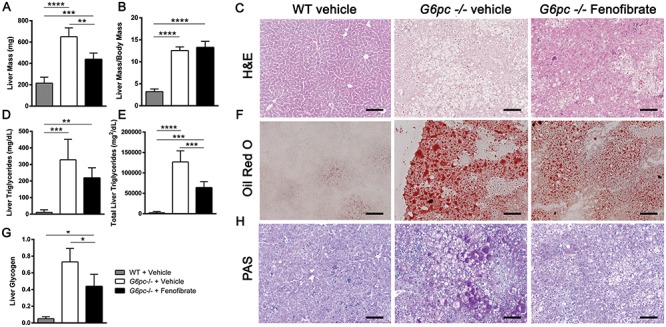
Liver triglycerides and glycogen are reduced by fenofibrate treatment in G6pc −/− mice. (A) Liver mass (mg) (n = 4–5). (B) Liver mass proportional to body mass (n = 4–5). (C) Representative liver H&E stain from three mice. Scale bar = 100 μm. (D) Liver triglycerides (mg/dL) measured by colorimetric assay (n = 4–5). (E) Total liver triglycerides (mg2/dL) calculated from liver weight and liver triglyceride assay (n = 4–5). (F) Representative liver Oil Red O stain from three mice. Scale bar = 100 μm. (G) Liver glycogen content measured by biochemical assay (n = 4). (H) Representative liver PAS glycogen stain from three mice. Scale bar = 100 μm. One-way ANOVA with Tukey’s multiple comparison test was performed. *P < 0.05; **P < 0.01; ***P < 0.001; ****P < 0.0001.
