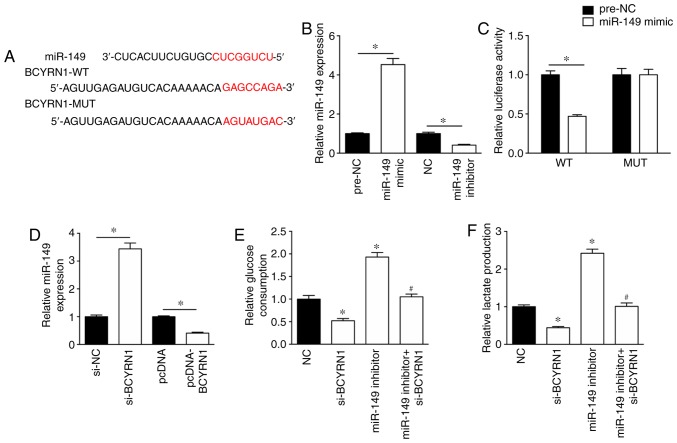
Figure 2.
miR-149 is involved in BCYRN1-regulated glycolysis. (A) Predicted binding site between BCYRN1 and miR-149. (B) miR-149 expression levels following transfection with miR-149 mimic or miR-149 inhibitor. (C) Luciferase assay suggested a relationship between BCYRN1 and miR-149 expression. (D) miR-149 expression levels were regulated by BCYRN1. miR-149 knockdown rescued the si-BCYRN1-induced decrease in (E) glucose consumption and (F) lactate production compared with the si-BCYRN1 group. *P<0.05 vs. si-NC or NC; #P<0.05 vs. si-BCYRN1. BCYRN1, brain cytoplasmic RNA 1; miR, microRNA; NC, negative control; si, small interfering RNA.

