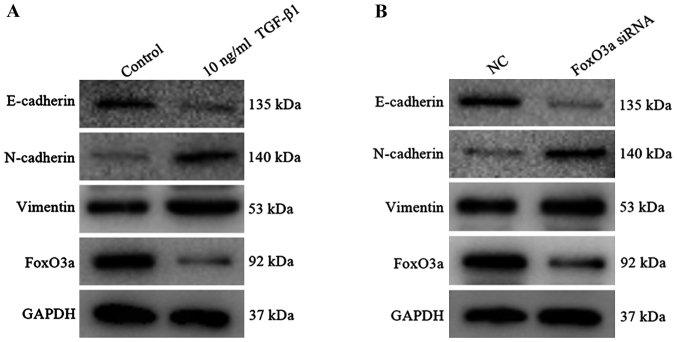
Figure 4.
Construction of the epithelial-to-mesenchymal transition model in HaCaT cells. (A) Protein expression of N-cadherin, E-Cadherin, vimentin and FoxO3a were measured by western blot analysis subsequent to TGF-β1 treatment. (B) Western blot analysis detected the change in N-cadherin, E-Cadherin, vimentin and FoxO3a expression once HaCaT cells were incubated with FoxO3a siRNA. FoxO3a, Forkhead box O3a; TGF-β1, transforming growth factor-β1; siRNA, small interfering RNA; NC, negative control.

