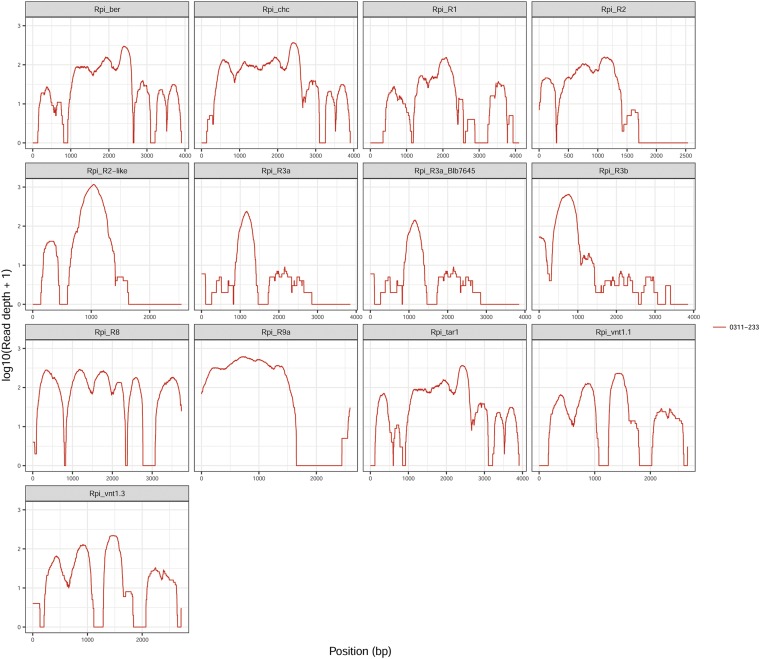
Figure 2.
dRenSeq analysis of 03112-233. RenSeq-derived reads were mapped against a reference set of 21 known NLR genes in very-sensitive mode, and the results for 13 NLRs are shown here. Each box represents an entire NLR coding sequence from the start codon to the stop codon (x-axis). The y-axis reveals the coverage of the NLRs on a log scale. Mapping of the reads was carried out at 0% and 2% mismatch rates, and the results for 2% mismatch rate are shown.

