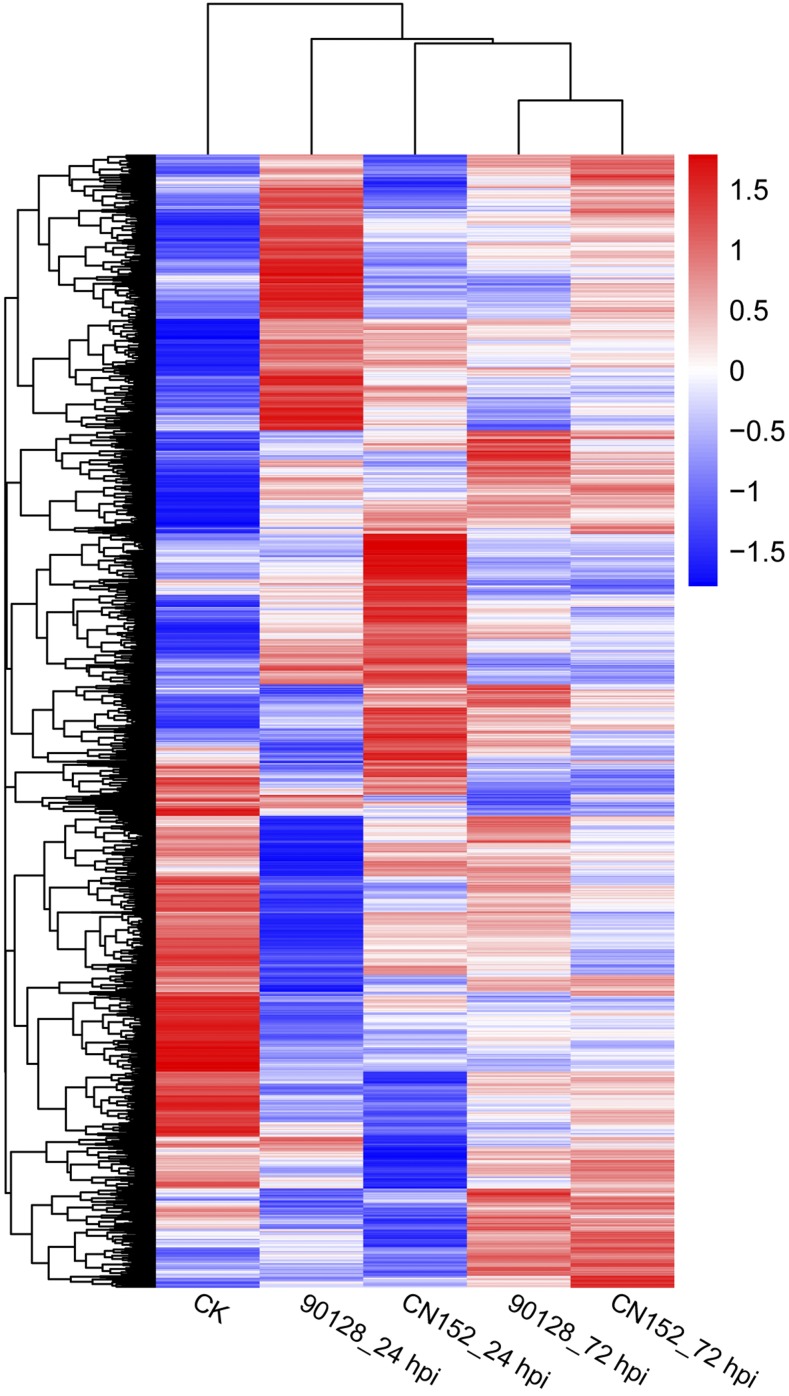
Figure 5.
Hierarchical clustering of DEGs identified in the five experimental treatments. Log10(FPKM+1) values were used to cluster 11,046 DEGs in Cluster 3.0, and the average values of FPKM from the three biological replicates were used for log10(FPKM+1) calculation. Red indicates high expression, and blue indicates low expression.

