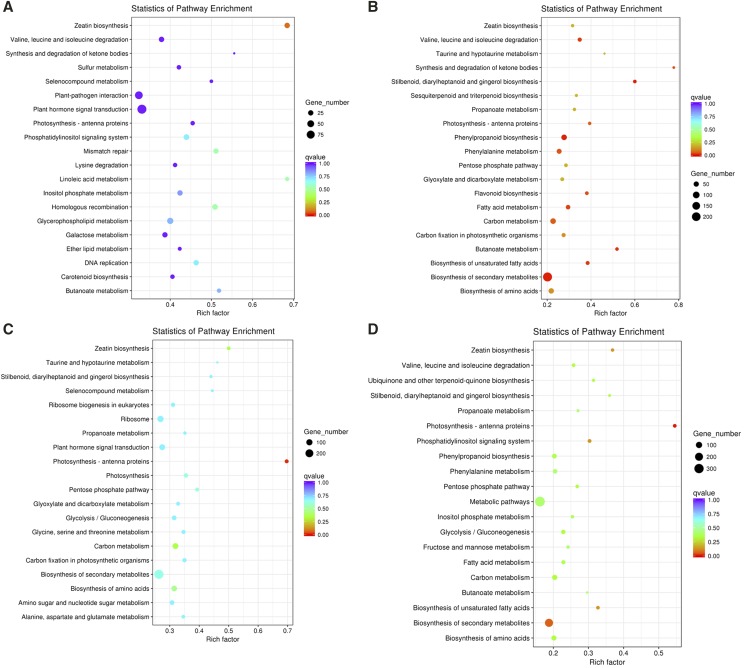
Figure 6.
The top 20 KEGG pathways enrichment of DEGs for the 90128-infected samples at 24 hpi (A) and 72 hpi (B) and for the CN152-infected samples at 24 hpi (C) and at 72 hpi (D). The x-axis indicates the rich factor and the y-axis indicates the pathway names. Rich factor refers to the ratio of the number of DEGs located in the KEGG pathway and the total number of genes in the KEGG pathway. The larger the rich factor the greater the degree of enrichment. Significant differences are considered at Benjamini–Hochberg adjusted p-value < 0.05.

