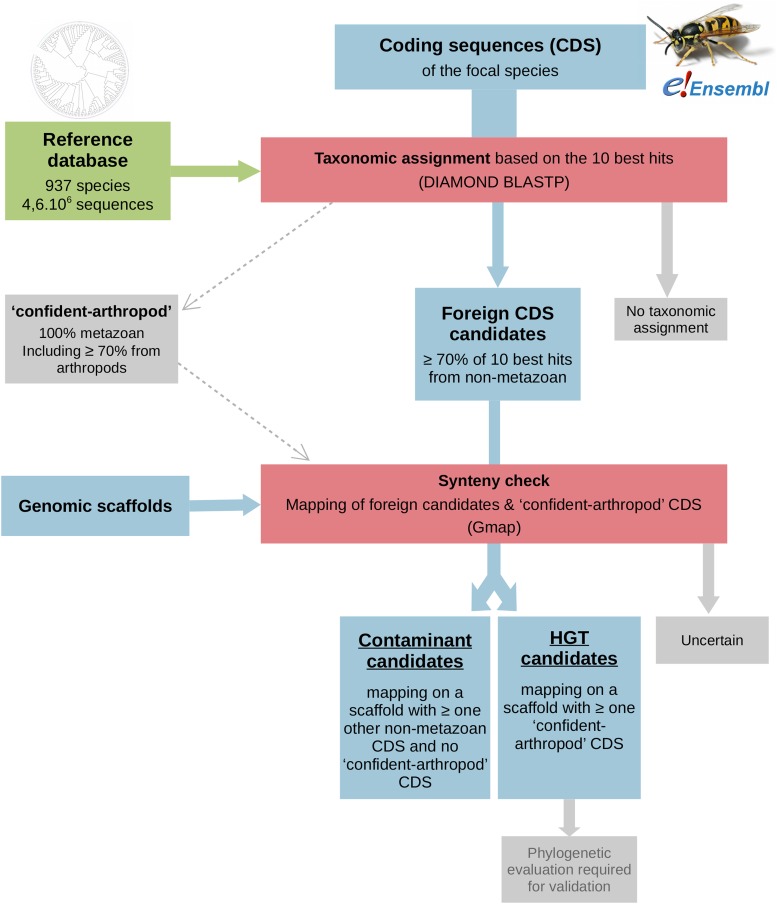
Figure 1.
A simplified flow diagram of the pipeline developed for this study. Each species assembly is evaluated independently through this pipeline, which requires the set of coding sequences (CDS) as well as the genomic scaffolds of each species, and an appropriate reference database. In this diagram, boxes referring to ‘data’, ‘reference database’ and ‘tools’ are colored in blue, green, and red, respectively. See the main text for detailed explanations.

