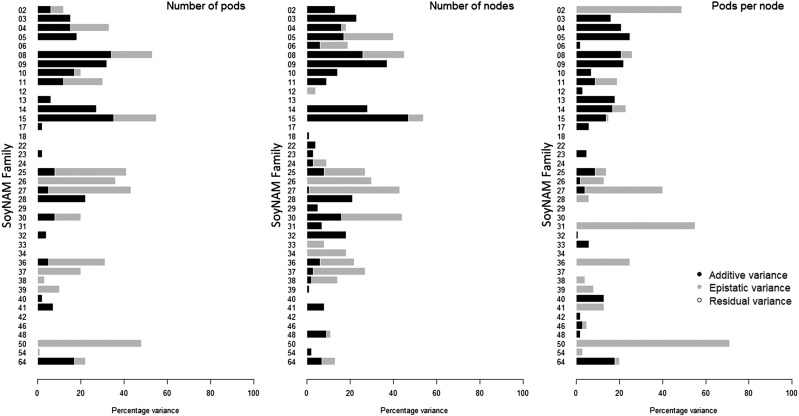
Figure 3.
Barplot of the proportion of variance explained by different genetic components of pod number (left), node number (center) and pods per node (right) by family. Additive (black), epistatic (gray) and residual (white) variances. Families had elite (2-23), diverse (24-39) and exotic (40-64) genetic background.

