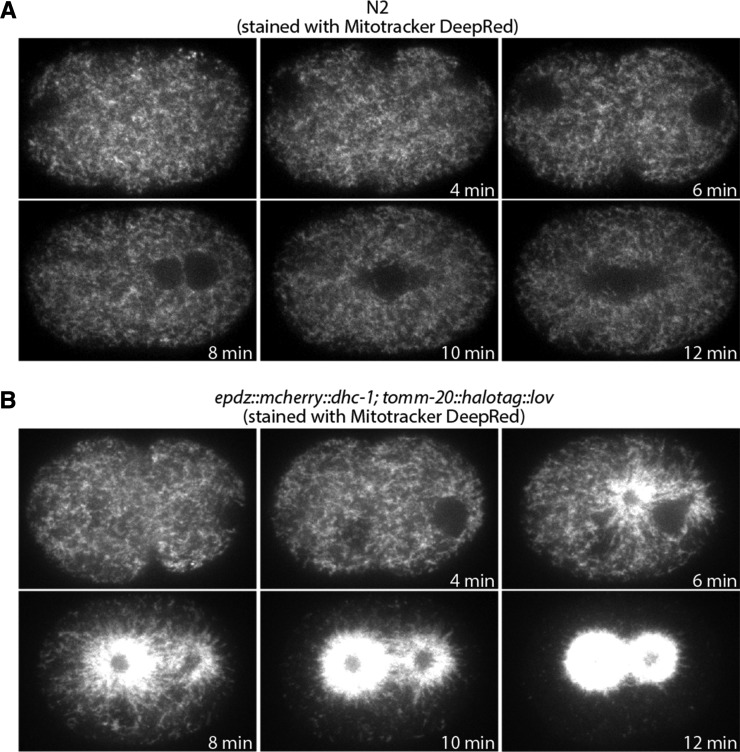
Figure 4.
Optogenetic control of mitochondrial distribution in the 1-cell embryo. A. Control embryo stained with Mitotracker DeepRed and imaged with 488 nm and 640 nm illumination (640 nm channel shown). B. 1-cell epdz::mcherry::dhc-1; tomm-20::halotag::lov embryo stained with Mitotracker DeepRed and imaged with 488 nm and 640 nm illumination (640 nm channel shown). The 488 nm illumination was used to stimulate the interaction between the ePDZ and LOV domains.

