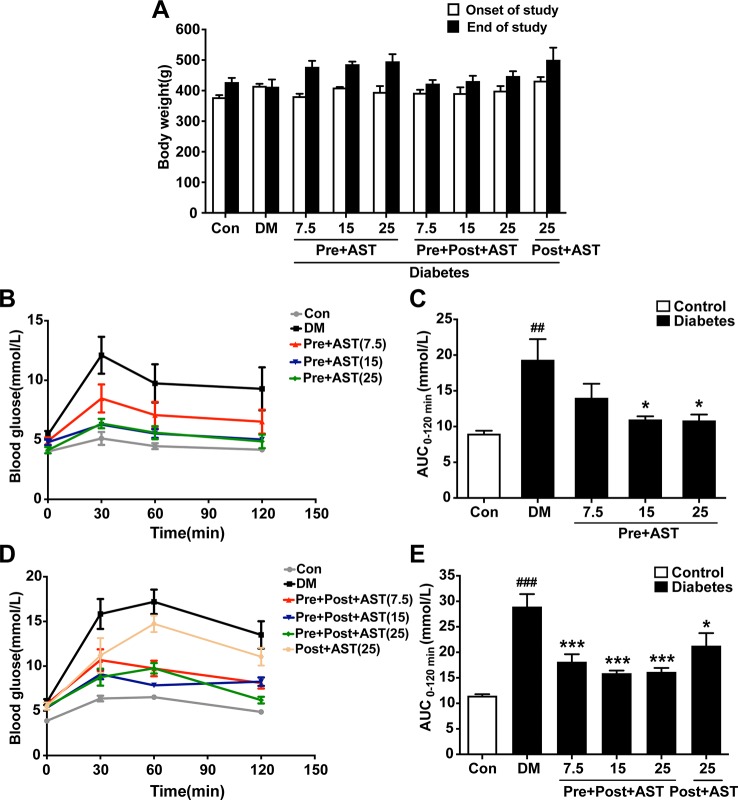
Figure 2.
Effects of AST treatment on body weight, blood glucose level, and area under the curve of OGTT. Diabetic rats given AST showed no significant difference among groups in body weight (A) but improved glucose tolerance as measured by blood glucose (B, D) and area under the curve of OGTT (C, E) compared with diabetic vehicle rats. Data are shown as the mean ± SEM (n = 6). ##p < 0.01, or ###p < 0.001 vs. control group, *p < 0.05, or ***p < 0.001 vs. DM group.

