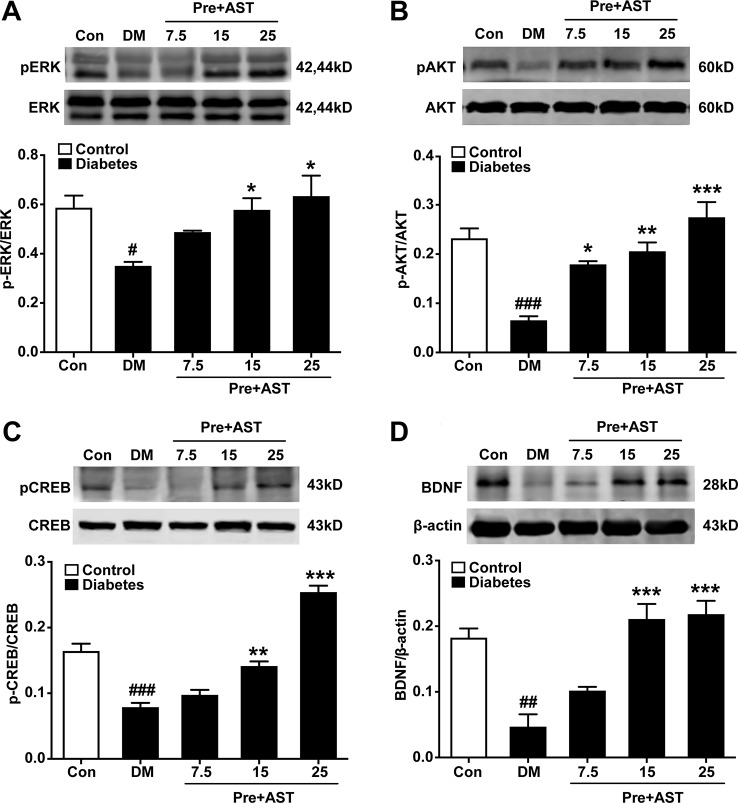
Figure 5.
Effects of preventive treatment with AST on the relative expression levels of pERK1/2, pAKT, pCREB, and BDNF in the PFC. The representative bands of phosphorylated ERK1/2 (A), phosphorylated AKT (B), phosphorylated CREB (C), and relative-expression BDNF (D) in the PFC and their histograms are shown. Data are shown as the mean ± SEM (n = 6). #p < 0.05, ##p < 0.01, or ###p < 0.001 vs. control group, *p < 0.05, **p < 0.01, or ***p < 0.001 vs. DM group.

