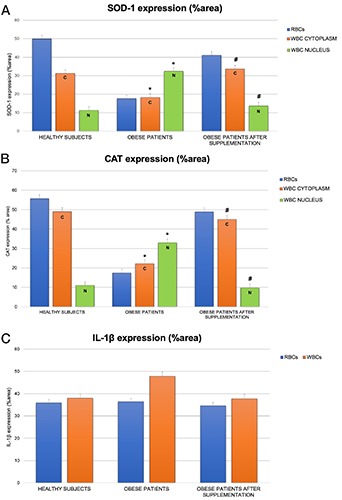
Figure 5.

Histograms showing SOD-1 (A), CAT (B), and IL-1β(C), expression quantitatively reported as %area, in RBCs and WBCs from healthy, obese and obese subjects before and after omega-3 PUFA supplementation. Bars indicate mean ± SD. *P≤0.05 vs healthy subjects, # P≤0.05 vs obese subjects; C, positivity expressed in the cytoplasm of WBCs; N, positivity expressed in the cytoplasm of WBCs.
