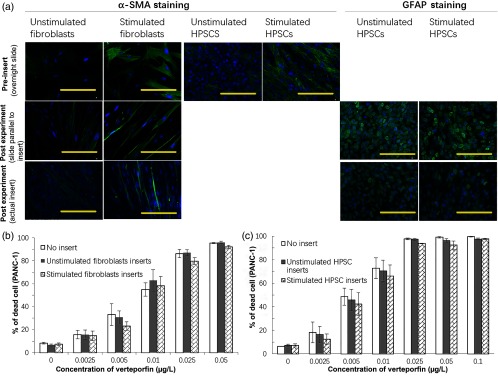
Fig. 4.
(a) Representative immunofluorescence results showed that the expression of -SMA was higher in fibroblasts or HPSCs stimulated by IL- and TNF- than in unstimulated cells, both pre-PDT and post-PDT. GFAP expression was positive in HPSCs, and the expression of GFAP was lower in stimulated HPSCs and postexperiment HPSCs. Nuclei stained blue with DAPI. -SMA and GFAP labeled in green by alex488. (Scale bar: ). (b) The percentage of death cell plotted with serial concentrations of verteporfin with or without fibroblasts inserts. (c) The percentage of death cell plotted with serial concentrations of verteporfin with or without HPSCs inserts.

