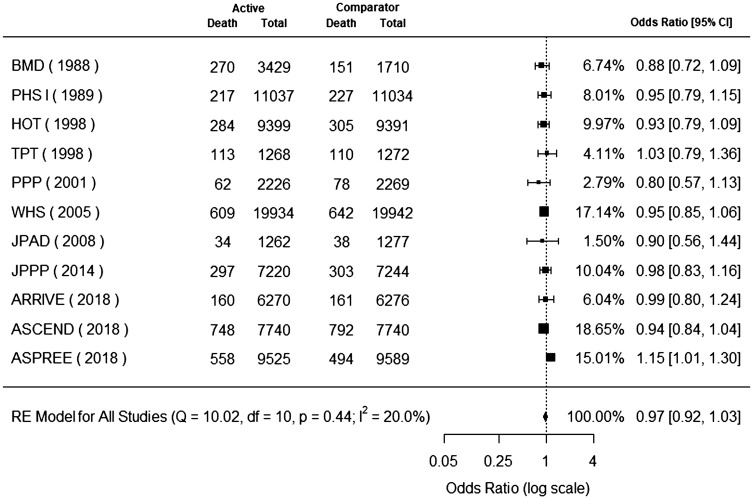
Figure 4.
Aspirin for primary cardiovascular prevention and benefit for all-cause mortality. Forest plot for all-cause mortality. Forest plot showing the effect of aspirin therapy on all-cause mortality. The squares and bars represent the mean values and 95% confidence intervals of the effect sizes, while the size of the squares reflects the weight of the studies. The combined effects appear as diamonds and the vertical dashed line represents the line of no effect.

