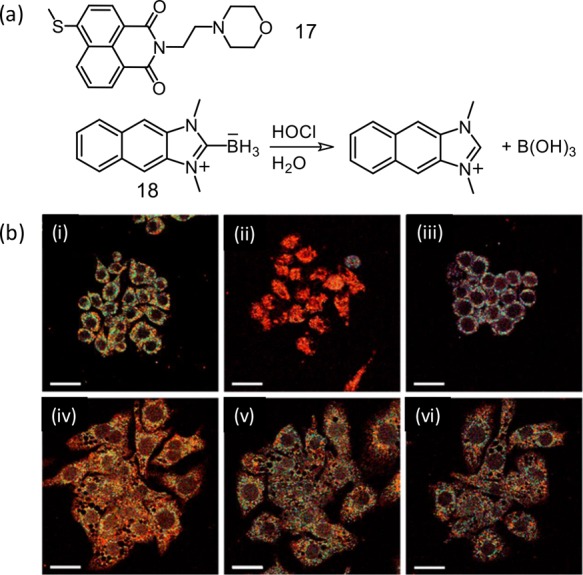
Figure 12.

(a) Molecular structures for reagents 17 and 18. (b) Pseudocolored ratiometric TPM images of Raw 264.7 cells labeled with 18 (10 μM) for 30 min: (i) control image. Cells pretreated with (ii) tunicamycin (known to increase oxidative stress of the ER (10 μg mL–1, 16 h)) through generation of H2O2, (iii) dithiothreitol that consumes H2O2 in the ER and reduces oxidative stress (2 mM, 16 h), (iv) lipopolysaccharides (100 ng mL–1, 16 h), interferon-γ (50 ng mL–1, 4 h), and phorbol myristate acetate (10 nM, 30 min), (v) lipopolysaccharides, interferon-γ, phorbol myristate acetate, and 4-aminobenzoic acid hydrazide (a MPO inhibitors) (50 μM, 4 h), and (vi) lipopolysaccharides, interferon-γ, PMA, and FFA (50 μM, 4 h) and then treated with 18 (λex = 720 nm), and TP microscopy images were acquired at 450–600 nm (green) and 380–430 nm (blue) channels. The scale bar is 20 μm. Figure 12b was reprinted from ref (38). Copyright 2017 American Chemical Society.
