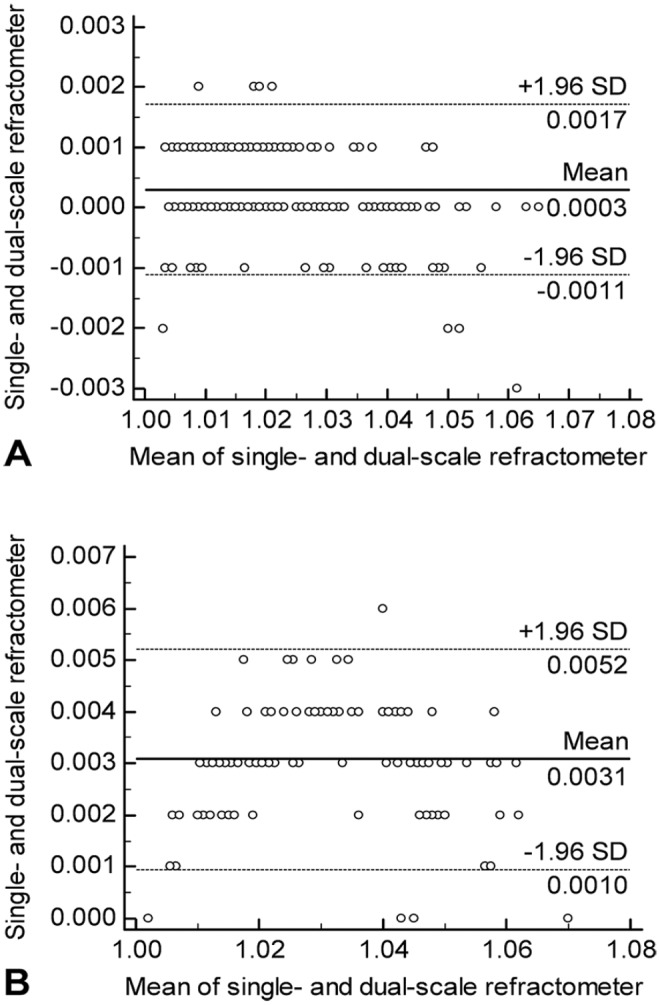
Figure 2.

Bland–Altman plot of fresh whole canine and feline urine specific gravity (USG) measured on single-scale and dual-scale refractometers. A. Bland–Altman plot for canine urine samples. B. Bland–Altman plot for feline urine samples. The solid line represents the mean difference, and the dashed lines represent the limits of agreement (= mean difference ± 1.96 standard deviation (SD) of differences).
