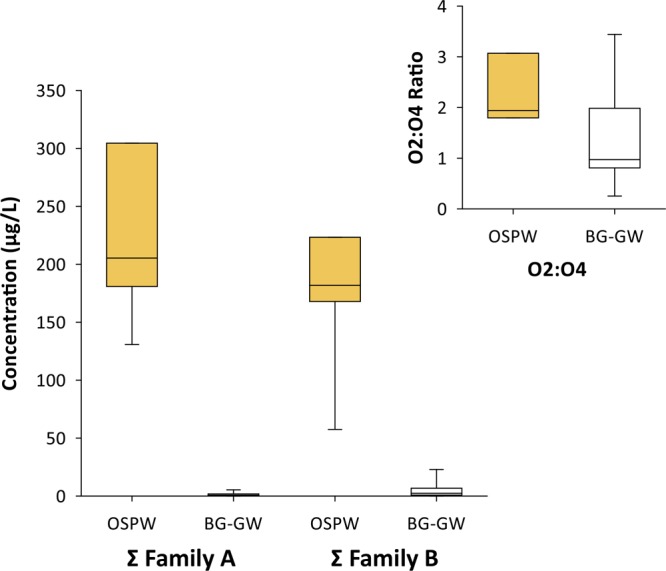
Figure 2.

Box plots showing mean and middle quartile (box) and range (whiskers) for total Family A and B monoaromatic acid concentrations and HRMS speciation ratios of O2- and O4-containing species compared between OSPW (n = 4 Family A-B, n = 3 O2/O4) and background groundwater (BG-GW; n = 16) samples.
