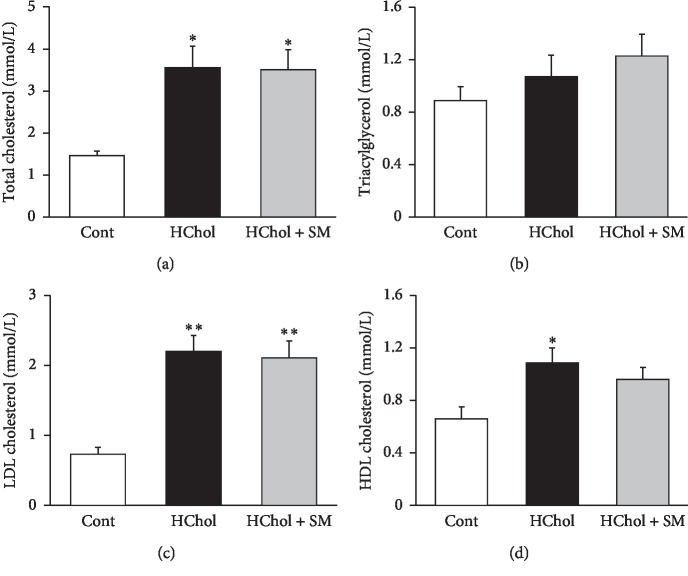
Figure 2.
Serum total cholesterol (a), serum triacylglycerol (b), LDL cholesterol (c), and HDL cholesterol (d) levels in rats fed either cholesterol-enriched (HChol), cholesterol-enriched + Stellaria media (HChol + SM), or normal diet (Cont). Results are means ± SEM (n = 8 in each group), analyzed by one-way ANOVA with the Tukey post hoc test. ∗p < 0.05 vs. control, ∗∗p < 0.01 vs. control.

