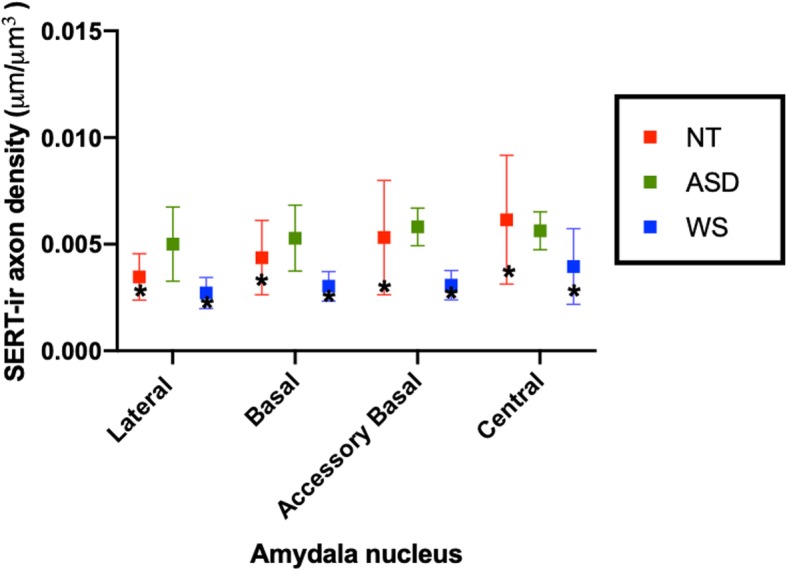
Fig. 3.

Mean SERT-ir axon density in the lateral, basal, accessory basal, and central nuclei of the amygdala in the adult subjects of each diagnostic group. The WS and NT adult means are overlaid by values of the WS and NT infant subjects (WS 7 and 5183, respectively) denoted by asterisks. Lines represent standard deviation of the mean. As observed in the figure, while WS and NT infant values are in the lower range of the adult values, they fall within the standard deviation of the adult mean
