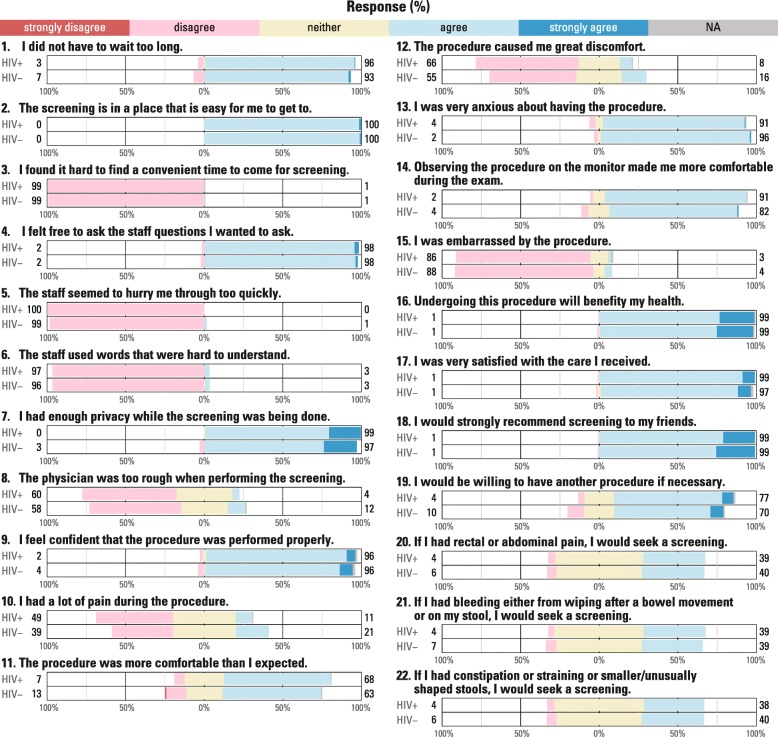
Fig. 1.
Likert Responses for Each Satisfaction Question Stratified by HIV Infection. Note: Numbers to the right of the bars indicate the total percent with any agreement (agree and strongly agree) and the numbers to the left indicate the total percent with any disagreement (disagree and strongly disagree). The percentages on the x axis indicate the cumulative proportion of Likert responses either in the agree or disagree direction. The neither agree or disagree proportion is centered at 0% and evenly split towards the agree or disagree direction

