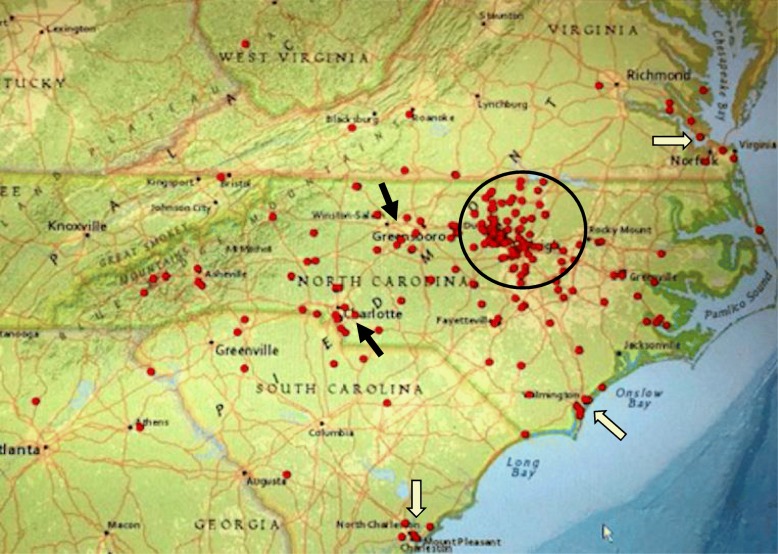
Fig. 2.
Map of the Carolinas and southern Virginia that shows the distribution of 238 cases of cHP who had a physical address that could be verified. The map was generated by the DEDUCE-Geo software. DEDUCE-Geo uses both ArcGIS Server (Esri, Redlands, CA) and JavaScript to execute the geospatial visualization of a cohort defined within DEDUCE. Each red dot represents one case of cHP. There is a major cluster around the Research Triangle area (circle). There also seemed to have more cases in other larger cities, such as Greensboro and Charlotte (black arrows) and in coast regions, such as Norfolk VA, Wilmington NC and Charleston SC (white arrows)

