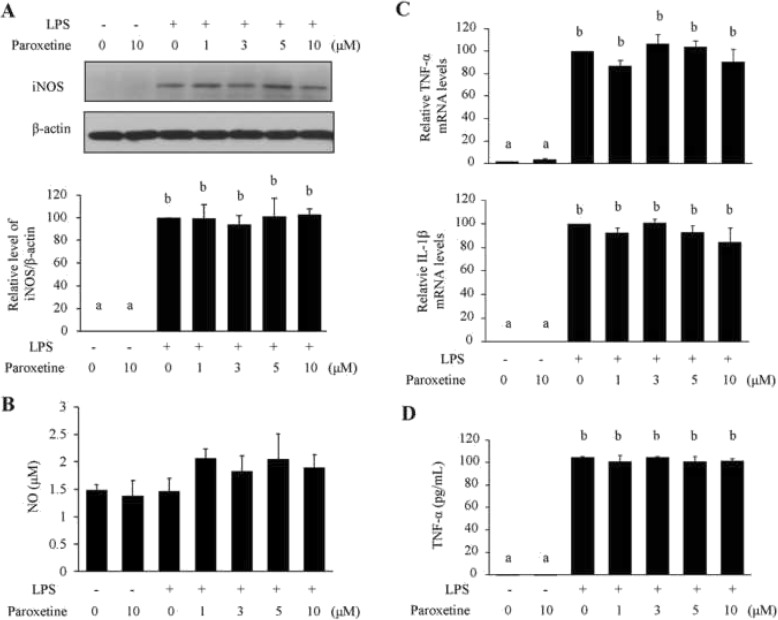
Fig. 3.
Effect of paroxetine on LPS-induced inflammatory responses in primary astrocytes. Cells were pretreated with paroxetine at different concentrations for 30 min followed by stimulation with LPS at 100 ng/mL for 24 h. a Western blot analysis of iNOS expression. Protein levels were quantified and normalized to their respective β-actin levels. Values were expressed relative to the one treated with LPS alone, which was set as 100. b NO production indicated by nitrite levels in culture media. c Quantitative PCR analyses of TNF-α and IL-1β expression. The mRNA levels were expressed relative to the one treated with LPS alone, which was set as 100. d Concentrations of TNF-α in culture media. Values are means ± SE, n = 3 for a, b, and d, n = 4 for c. Statistical comparisons were performed using one-way ANOVA, followed by Tukey’s post hoc test. Different letters indicate p < 0.05. IL-1β, interleukin 1β; iNOS, inducible nitric oxide synthase; LPS, lipopolysaccharide; NO, nitric oxide; TNF-α, tumor necrosis factor α

