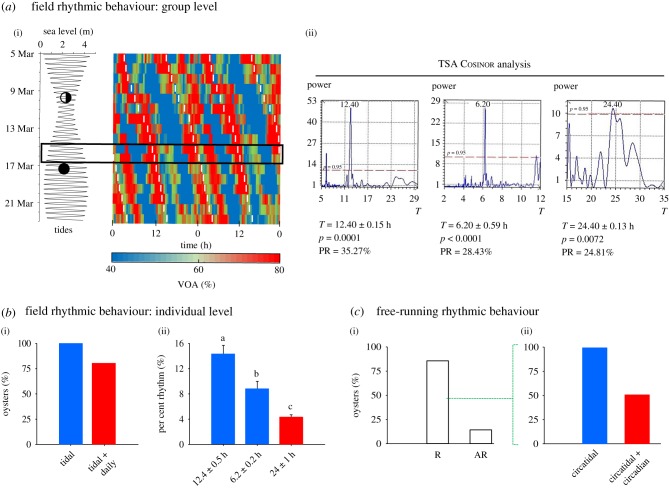
Figure 2.
Valve activity to determine tidal and daily influences on oyster behaviour. (a(i)). Coloured panel shows a double-plotted actogram of the field mean VOA on 15 oysters at 4 m depths (±tides) over 18 days in Arcachon Bay, France. On the left, tide amplitudes are represented by sea level during this period. Black and half-black circles represent the new moon and the third-quarter moon, respectively. White dashed lines on the actogram represent the high tides. The rectangle shows the period of gene expression sampling times. Experimental conditions, sunset, sunrise, moon illumination and position, sea level, light intensity and water temperature are detailed in the electronic supplementary material table S1 and figure S1. (a(ii)) Chronobiological analysis of the mean valve behaviour during the field experiment. Time-series analysis Cosinor analysis was used to detect tidal periodicities (12.4 and 6.2 h periods) and daily periodicity (24 h). Significant rhythms were determined by the periods found with Lomb and Scargle periodograms (above the dotted line, corresponding to p > 0.95, peaks of significant periods T, the power corresponds to the intensity of the period) and by the adjusted p-value of the cosinor model. PR corresponds to the per cent rhythm (%) of the model. The second periodicities correspond to the second significant periodicities after residue injections. (b) Field chronobiological analysis of individual oyster VOAs. (b(i)) Percentage of rhythmic oysters (n = 15) expressing solely a tidal pattern or expressing at the time a tidal and a daily pattern. (b(ii)) The mean PR (i.e. the percentage of rhythmicity explained by the Cosinor model) according to the tidal periodicities (12.4 ± 0.5 and 6.2 ± 0.2 h) and the daily one (24.0 ± 1.0 h). Different letters represent significant differences at adjusted p < 0.05 (one-way ANOVA test and Bonferroni post hoc test). Detailed analysis are presented in the electronic supplementary material, figure S2 and table S2. (c) Rhythmic analysis on individual VOA over 7 days under laboratory FR conditions (constant darkness, DD). (c(i)) TSA Cosinor analysis was used to detect a significant rhythm (n = 14 oysters; R, rhythmic individuals (p < 0.05); AR, arrhythmic individuals). (c(ii)) Percentage of rhythmic individuals with solely circatidal periodicity (approx. 12.4 h) or expressing at time a circatidal and a circadian periodicity (approx. 24 h). Individual profiles and periodograms are detailed in the electronic supplementary material, figure S3.

