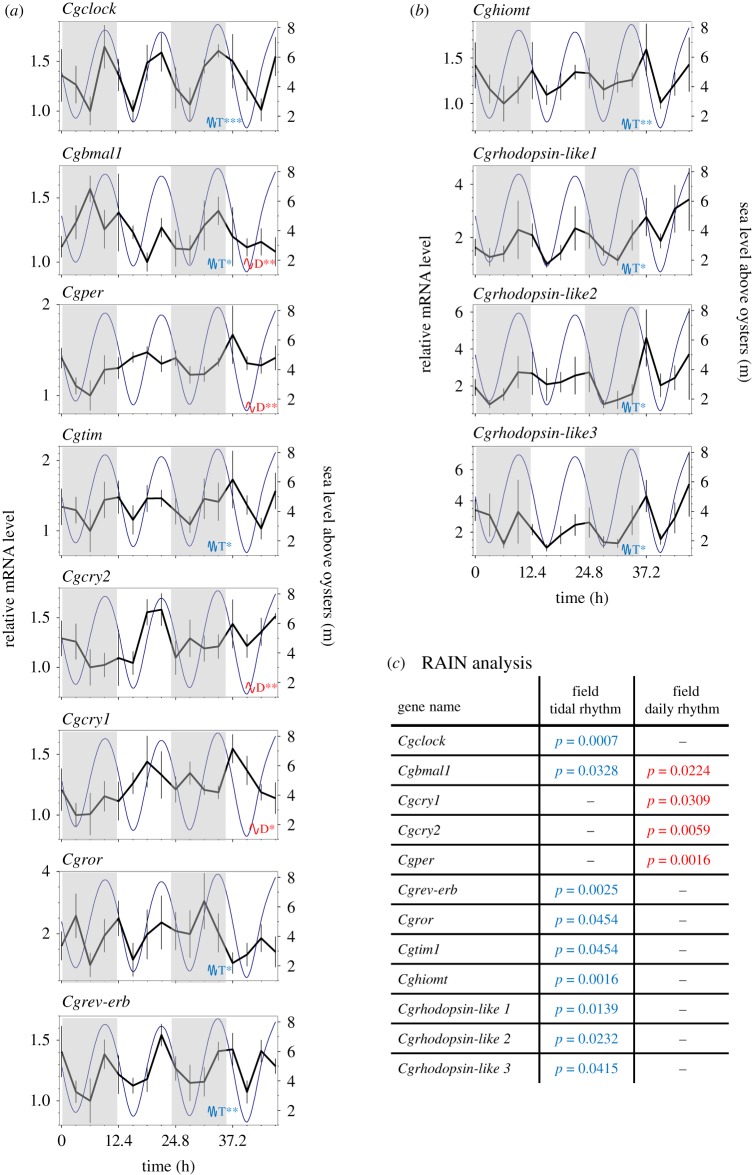
Figure 3.
Cyclic expression patterns of C. gigas clock genes in the field. Temporal profiles of core clock genes (a) and clock-associated genes (b) mRNA levels were measured in C. gigas gills sampled in the field. Grey areas indicate night phases. Dark blue lines indicate sea level above oysters in metres (tides) on the right axis. Values are expressed in relative mRNA levels, means ± s.e.m., n = 5–7 individual replicates per time point (16 sampling times every 3.1 h for 46.5 h). For clock genes full names, see the electronic supplementary material, table S3. Data were analysed for rhythmic expression using the R package RAIN. The blue T indicates significant tidal rhythm (approx. 12.4 h), and the red D indicates significant daily rhythm (approx. 24 h). Asterisks indicate the power of significance: *p < 0.05; **p < 0.01; ***p < 0.001. (c) Inserted table of exact adjusted p-values using RAIN analysis. For details of the experimental sampling and environmental conditions, see the electronic supplementary material table S1 and figure S1.

