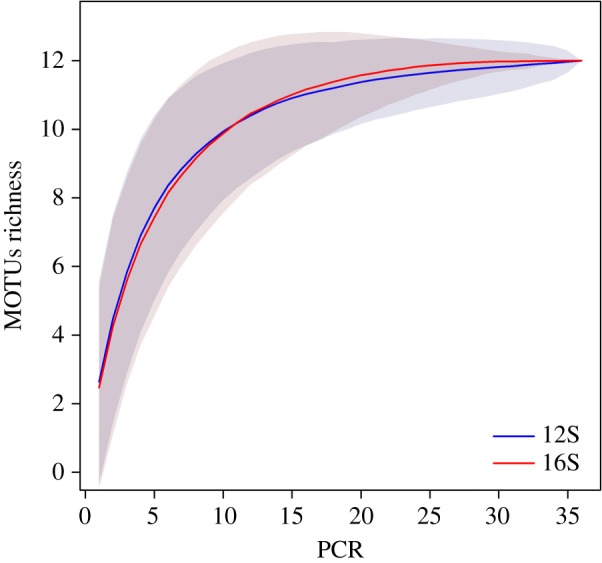
Figure 1.

MOTUs accumulation curves of both metabarcodes (16S and 12S) by PCR product. MOTUs were merged at the family level. Grey areas correspond to the standard deviation, estimated from 1000 random permutations. (Online version in colour.)

MOTUs accumulation curves of both metabarcodes (16S and 12S) by PCR product. MOTUs were merged at the family level. Grey areas correspond to the standard deviation, estimated from 1000 random permutations. (Online version in colour.)