Figure 3.
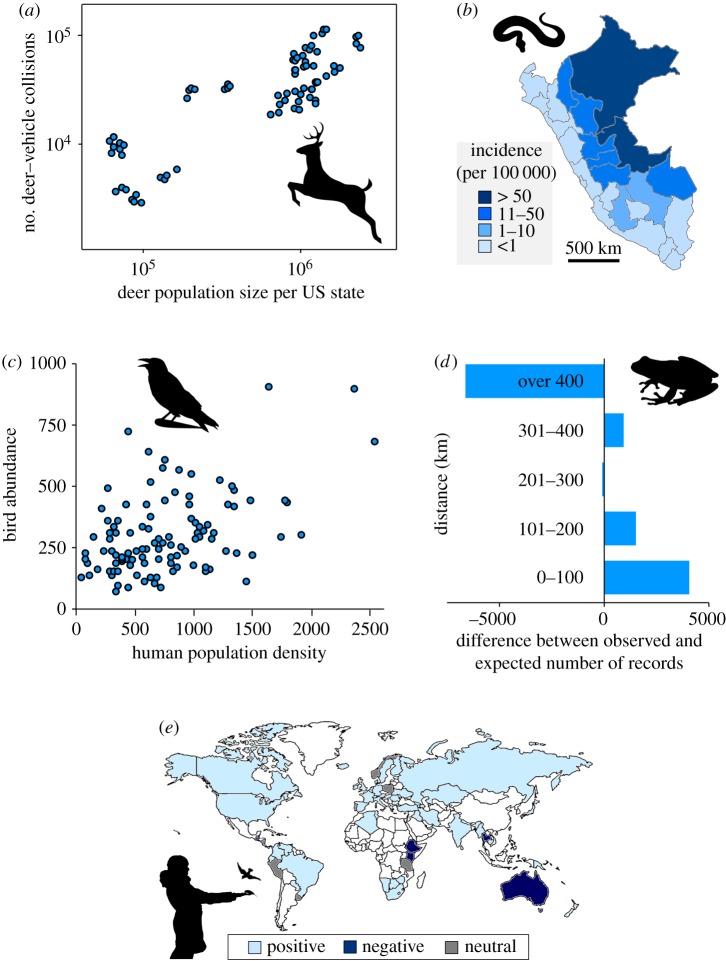
Examples of spatial dynamics of human–nature interactions. (a) Annual number of deer–vehicle collisions as a function of deer population size in each US state (note that: each state has four data points) within the historical range of the eastern cougar, 2009–2012 [33]. (b) Geographical distribution of incidence of snake bites in Peru 2000–2015 [9]. (c) Relationship between human population density and abundance of sets of bird species that commonly display behaviours that are negative for human wellbeing (e.g. crow, magpie) in southern England [41]. (d) Differences between the observed and expected number of records of frog species obtained by the South African Frog Atlas Project within distance bands from cities [42]. The record data were collected through various methods and sources, such as herpetological volunteers' field survey and museum and personal databases (i.e. historical records), which covers approximately 100 years of frog sampling. (e) Distribution of countries that have policies with positive, negative or neutral views of wild bird feeding [43]. Light blue shading indicates countries where the modal policy position represents a positive view, dark blue shading represents countries where the modal policy position was negative and grey shading represents countries where the modal policy position was neutral concerning wild bird feeding activity (see [43] for more details). Countries shaded white have no information available. (Online version in colour.)

