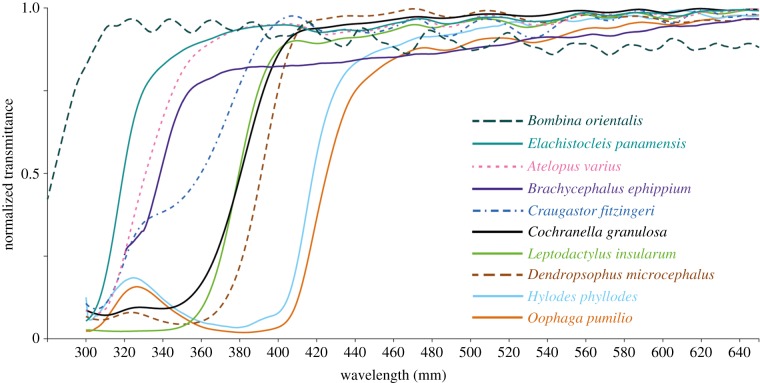
Figure 3.
Lens transmittance curves from some of the species in the study. The x-axis is cut at 650 nm to ease visualization of the curves at short wavelengths. See the electronic supplementary material, S1H for curves from the rest of the species, and the electronic supplementary material, S2 for full transmittance datasets. (Online version in colour.)

