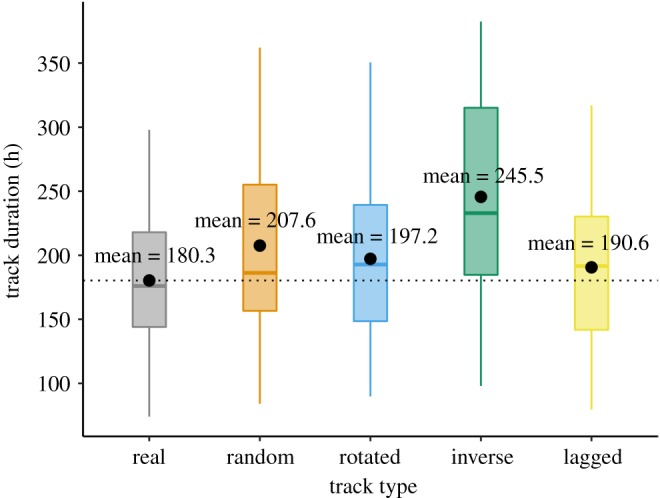
Figure 3.

Boxplot showing the track duration (in hours) of the real, random, rotated, inverse and time-lagged trips. The black circle represents the mean and the black dotted line shows the real tracks' mean. Real trips are significantly shorter than the respective random, rotated, inverse and time-lagged ones. (Online version in colour.)
