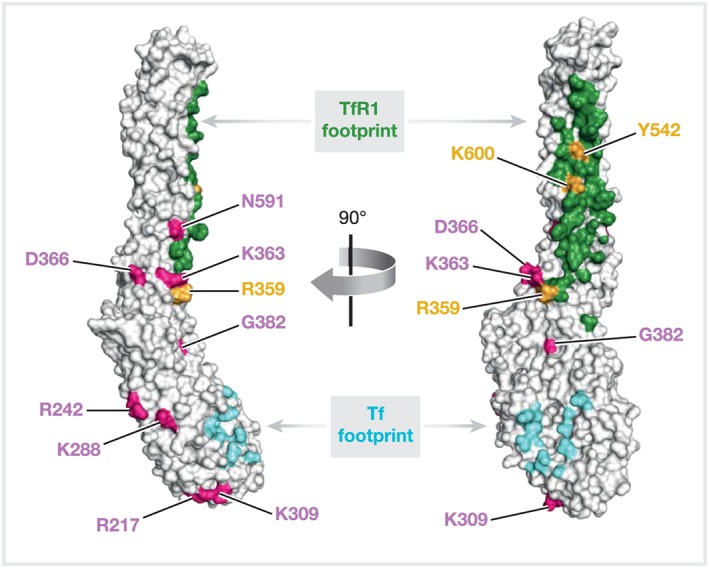
Figure 1.

Surface representation of the cryo‐EM structure of PvRBP2b (168 to 633) shown in two orthogonal views. Regions interacting with TfR1 and Tf are shown in green and cyan, respectively. Field polymorphisms are labelled in pink and residues critical for TfR1 binding are labelled in orange
