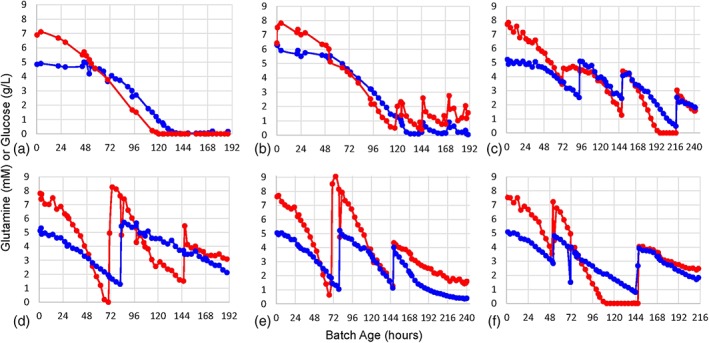
Figure 1.

Glutamine and glucose feed strategies. Glutamine measurements (mM) are shown in red and glucose measurements (g/L) are shown in blue. The graphs are organized by feed strategy: (a) batch strategy 1, (b) fed‐batch strategy 2, (c) fed‐batch and amino acid supplementation strategy 4, (d) fed‐batch and amino acid supplementation strategy 5, (e) fed‐batch and amino acid supplementation strategy 6, (f) fed‐batch and amino acid supplementation strategy 7
