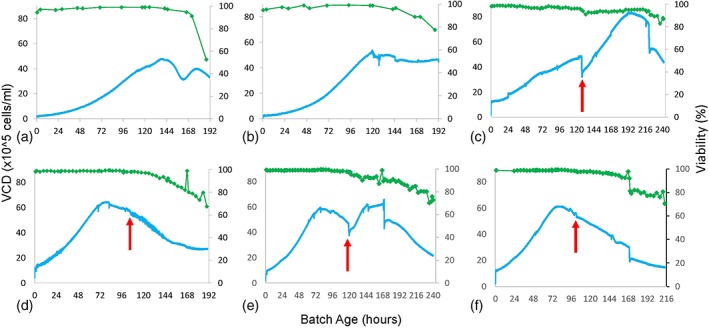
Figure 2.

Growth profiles for different feeding strategies. VCD (105 cells/ml) is shown in blue as measured by biocapacitance and green data points are viability (%) measurements. The red arrows indicate when the first amino acid supplementation event occurred. (a) batch strategy 1, (b) fed‐batch strategy 2, (c) fed‐batch and amino acid supplementation strategy 4, (d) fed‐batch and amino acid supplementation strategy 5, (e) fed‐batch and amino acid supplementation strategy 6, (f) fed‐batch and amino acid supplementation strategy 7
