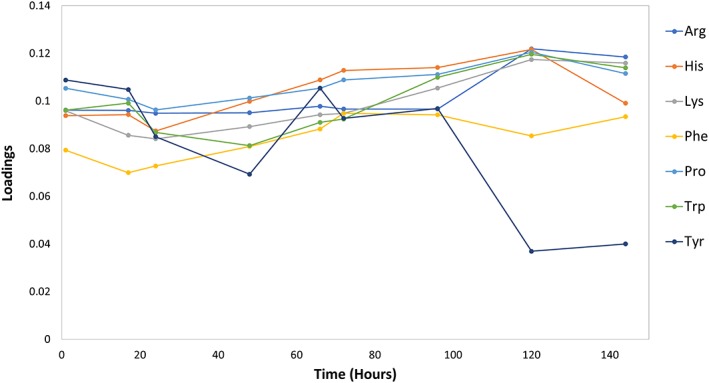
Figure 6.

Time dependence of the amino acid correlation with final glycan profile outcomes. The most significant amino acids were mapped over batch age time (hours) to reveal time‐dependent trends for correlation between each constituent and glycan profile. While most of the amino acids increased with significance over time, tyrosine decreased over the final 48 hr when the first amino acid supplementation events occurred
