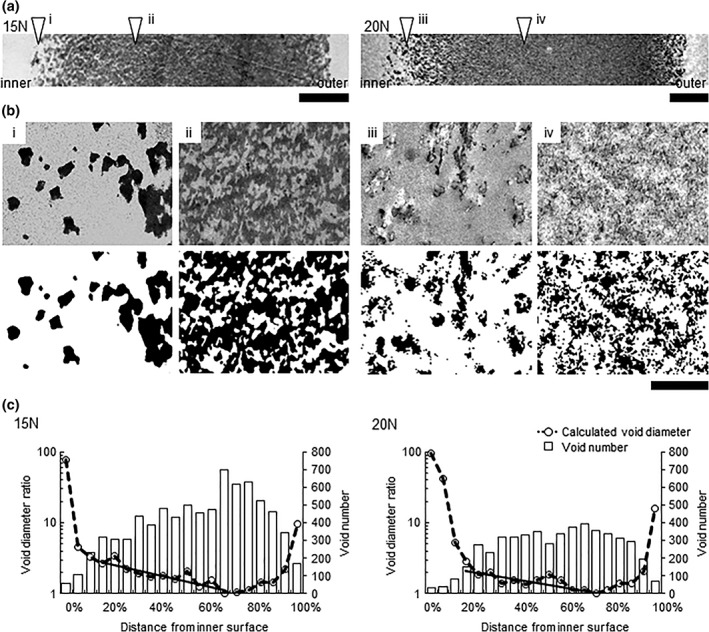
Figure 1.

Analysis of the gross structure of Planova 15N and 20N membranes. (a) Transmission electron microscopy (TEM) images of membrane ultrathin cross‐sections. Bar: 5 μm. (b) (i)–(iv) Binarization of TEM images. White and black areas indicate voids and regenerated cellulose, respectively. The left and right side of the images are the inner and outer side of the membranes, respectively. Bar: 500 nm. (c) Void diameter ratio (dashed lines) and void number (open bars) with increasing distance from the inner membrane surface. The smallest calculated void diameters (210 and 383 nm for Planova 15N and 20N, respectively) across all intervals (n = 20) were set to 1. The solid line represents the exponential regression curve for the dense middle layer (corresponding to the regions at 20–70% and 20–75% from the inner surface in Planova 15N and 20N filter membranes, respectively)
