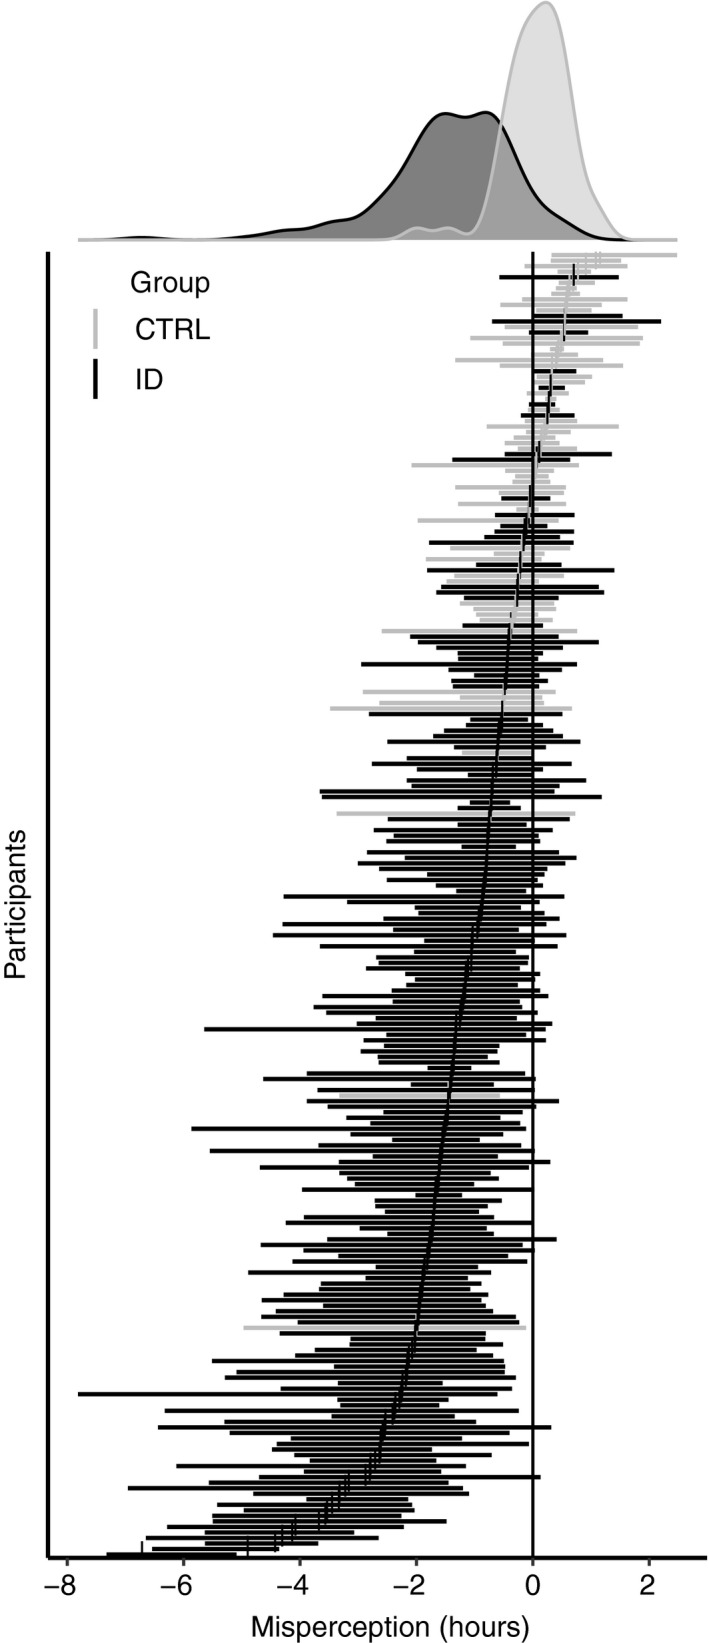
Figure 1.

The mean and range of misperception for each individual derived from up to 7 ambulatory nights of actigraphy and sleep diaries. Both Insomnia Disorder (ID, black) and good sleepers are plotted (CTRL, grey). The density plots summarize the group distribution of subject average misperception
