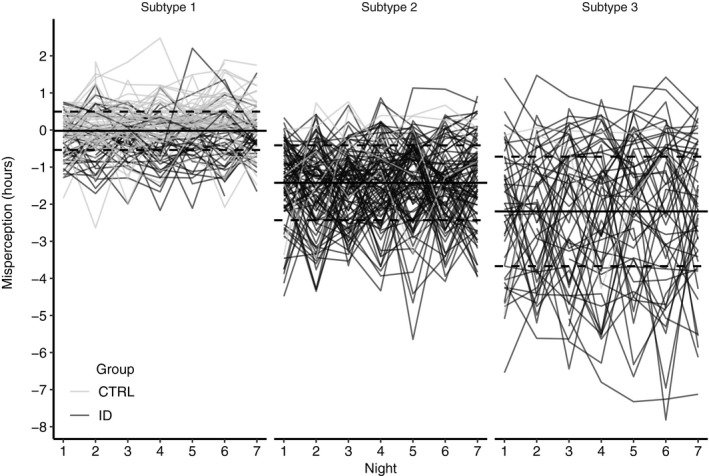
Figure 3.

Misperception of sleep across 7 ambulatory nights for individuals assigned to each of the three classes derived from the latent class cluster analysis (LCA). Individual traces of misperception are plotted for people with Insomnia Disorder (ID, black) and good sleepers (CTRL, grey). Mean misperception (dashed lines) and ± SD (dotted lines) derived from the LCA model
