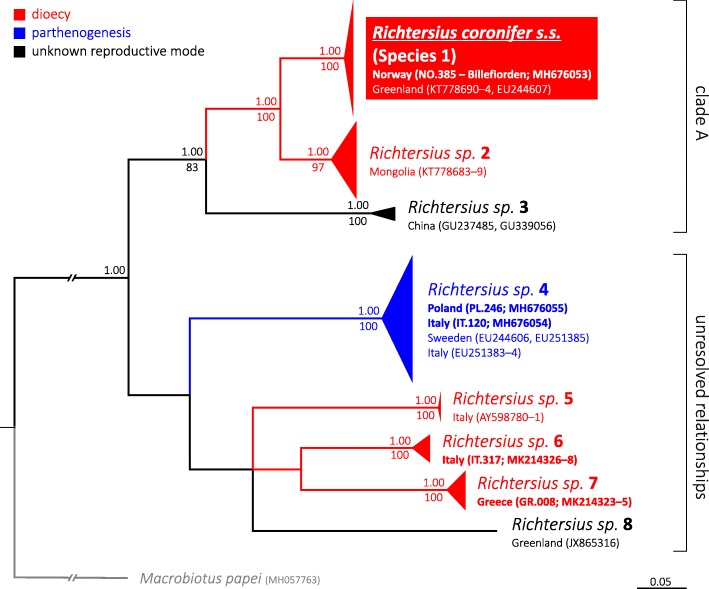
Fig. 9.
The Richtersius phylogeny constructed from COI sequences obtained in this study and from sequences available from GenBank. Numbers above the nodes indicate Bayesian posterior probability whereas the numbers under the nodes show bootstrap support values. The Bayesian Inference and Maximum Likelihood tree topologies were identical, thus only the Bayesian tree is shown. The Billefjorden population (which is proposed as new neotype population) is underlined whereas other newly found populations and new sequences are bolded. Please see “Comparative molecular analysis” and “Phylogenetic analysis” subsections in Material and Methods for details on sequences used in the analysis. The outgroup is marked with grey font and branches. The scale bar represents substitutions per position

