Figure 2.

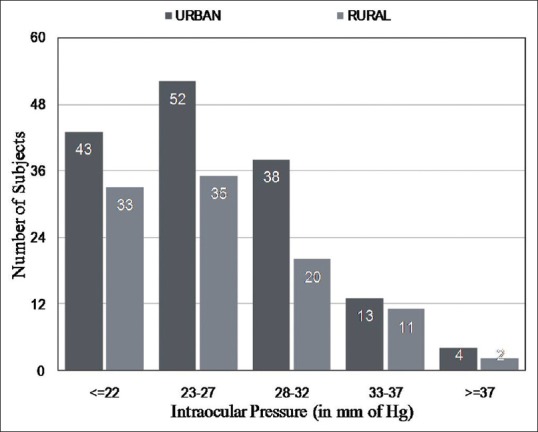
The distribution of intraocular pressure (IOP) in subjects diagnosed with POAG in the urban and rural divisions of the HRGS

The distribution of intraocular pressure (IOP) in subjects diagnosed with POAG in the urban and rural divisions of the HRGS