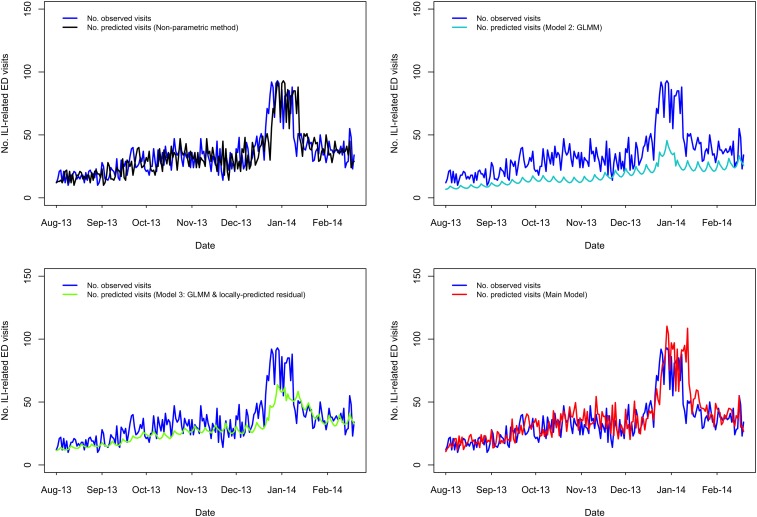
Fig. 2.
Comparing the predicted and observed number of ILI-related ED visits for each method for the 2013–14 influenza season (1 August 2013–19 February 2014), Edmonton, Alberta. Observed visit volumes (blue) are compared to predicted visit volumes from the non-parametric method (black), Models 2 (light blue) and 3 (green) and the Main Model (red).

