. 2020 Jan 2;19:16–32. doi: 10.17179/excli2019-1940

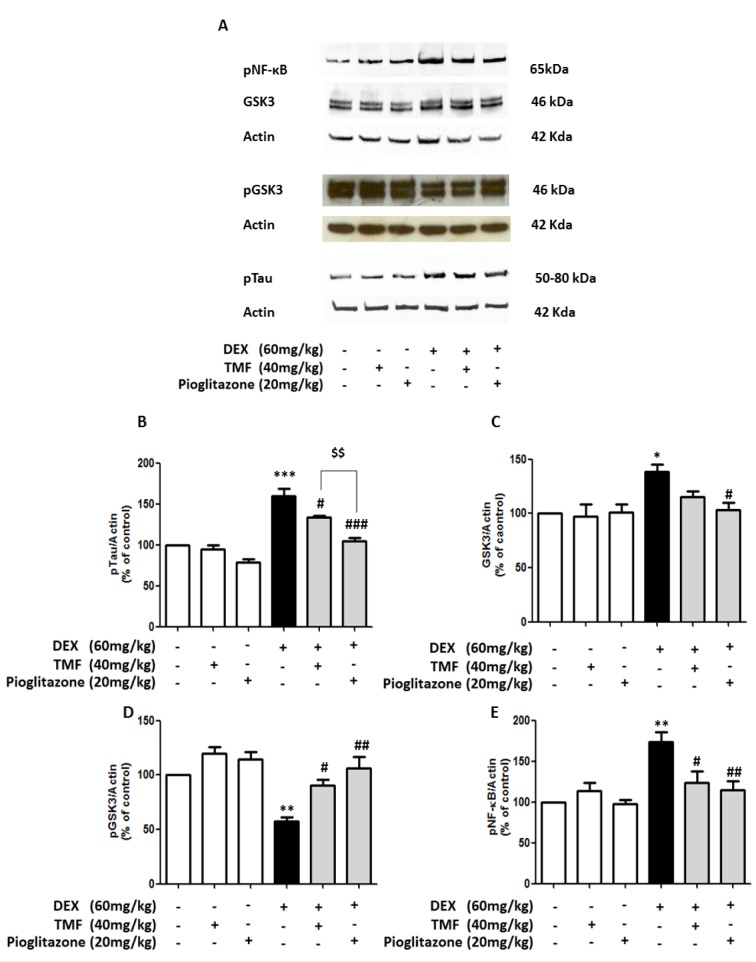
Figure 5. The attenuation effect of TMF on pTau expression. (A) Representative of GSK3, pGSK3, pNF-κB and pTau protein expression as determined by Western blotting. Brain tissues were used for electrophoresis and immune blotting. The bands were analyzed and are presented as a histogram, with actin as the control. (B) The quantitative results of all groups for pTau expression. (C) The quantitative results of all groups for GSK3 expression. (D) The quantitative results of all groups for pGSK3 expression. (E) The quantitative results of all groups for pNF-κB expression. The data are the mean ± SEM from three independent experiments (*p<0.01, **p<0.01, ***p<0.001 compared with the control group, #p<0.05, ##p<0.01, ###p<0.001 compared with the DEX group, $$p<0.01 compared with pioglitazone treatment in the DEX administration group).

Figure 5