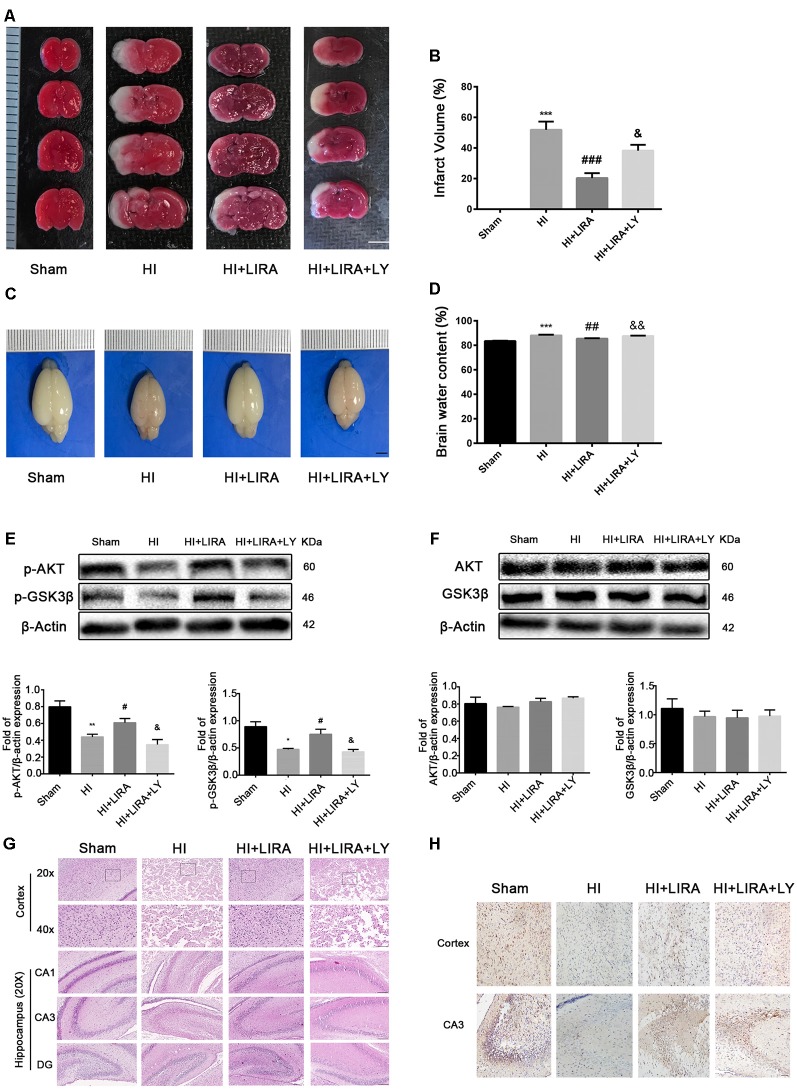
Figure 6.
Treatment with liraglutide (LIRA) exerted neuroprotection by activating the phosphoinositide 3-kinase (PI3K)/protein kinase B (Akt)/glycogen synthase kinase-3β (GSK3β) pathway. (A) Representative TTC-stained coronal brain sections 24 h after HI. n = 4. Scale bar = 1 mm. (B) Quantitative analysis of infarct volume. ***P < 0.001 vs. the sham group. ###P < 0.001 vs. the HI group. &P < 0.05 vs. the HI + LIRA group. Values are presented as mean ± SEM. n = 4. (C) The general shape of the brain 24 h after HI. n = 5. Scale bar = 1 mm. (D) Quantification of water content in the ipsilateral brain hemisphere 24 h after HI. ***P < 0.001 vs. the sham group. ##P < 0.01 vs. the HI group. &&P < 0.01 vs. the HI + LIRA group. Values are presented as mean ± SEM. n = 5. (E) Protein expression level and quantification data of p-AKT and p-GSK3β 24 h after HI injury. *P < 0.05 and **P < 0.01 vs. the sham group. #P < 0.05 vs. the HI group. &P < 0.05 vs. the HI + LIRA group. Values are presented as mean ± SEM. n = 3. (F) Protein expression level and quantification data of AKT and GSK3β 24 h after HI injury. Values are presented as mean ± SEM. n = 3. (G) Representative images of H&E staining in the cortex and hippocampus of CA1, CA3, and dentate gyrus at day 7 post HI injury. Scale bar = 25 μm, 50 μm. (H) Representative images of immunohistochemical staining for p-GSK3β. Scale bar = 50 μm.

