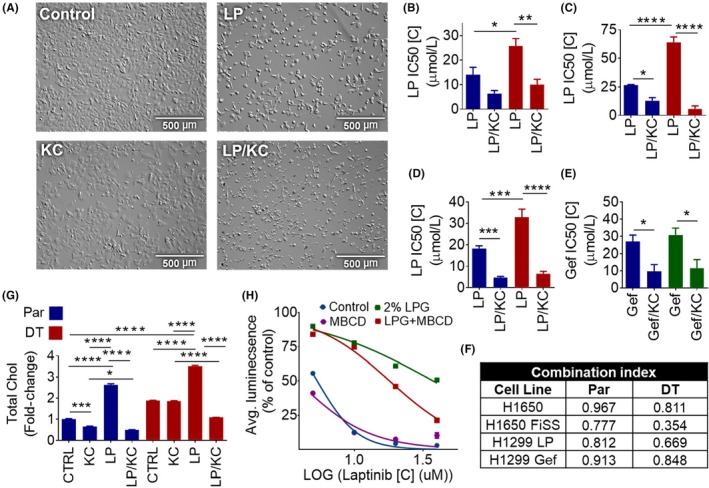
Figure 3.

Ketoconazole and EGFR TKI Therapy Overcomes EGFR TKI Tolerance by Stopping Upregulation of Cholesterol. A, Cellular morphology after lapatinib and ketoconazole combination therapy. Parental and lapatinib DT H1650 cells were plated and treated with 12.5 μM lapatinib (LP), 15μM ketoconazole (KC), or a combination of both. They were allowed to grow for 72 h. Bright field microscopy at 100X is shown. B‐E, Lapatinib and ketoconazole combination sensitivity in parental and DT cell lines. Cells were treated the next day after plating with varying concentrations of the identified drug/drugs for 48 h. Monolayer and FiSS drug sensitivity experiments were performed as described previously. Average IC50 value ± SEM on monolayer and the FiSS is shown, H1650 (N = 4) (B) H1650 FiSS (N = 3) (C), H1299 lapatinib (LP) (N = 5) (D), and H1299 gefitinib (Gef) (N = 5) (E). ANOVA and the Bonferroni post hoc test were used to determine the significance. F, CI was calculated for each cell line using the average IC50 values. G, Cholesterol content after lapatinib and ketoconazole combination therapy. Parental (Par) and lapatinib DT H1650 cells were treated the day after seeding with 10 μM lapatinib, 20 μM ketoconazole, or a combination of both for 48 h. Average fold change ±SEM, compared to untreated parental, is shown (N = 2). ANOVA and the Tukey post hoc test were used to determine the significance. H, Lapatinib sensitivity in H1650 parental cells. H1650 (N = 3) cells were plated in complete growth media or complete growth media containing 2% Lipogro (LPG). Cells were treated the day after seeding, in triplicates, with varying concentrations of the lapatinib for 48 h. Dose response curve is shown. *P < .05, **P < .01, ***P < .001, ****P < .0001
