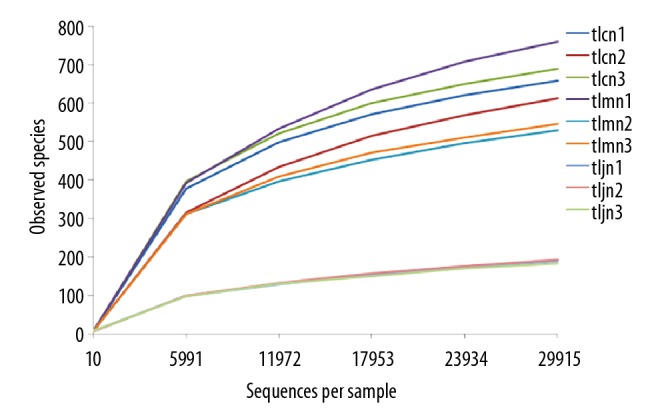
Figure 2.

Rarefaction curve of gene from each sample. The abscissa represents the number of lactase gene sequences extracted randomly; the ordinate represents the number of observed OTUs of the lactase gene. The data indicate that the sequencing tended to be saturated and that increasing the amount of data would have no significant effect on obtaining a new OTU when the curve tended to be flat. tlcn1–3, tlmn1–3, and tljn1-3 represent normal groups 1–3, model groups 1–3, and D. hansenii groups 1–3, respectively.
