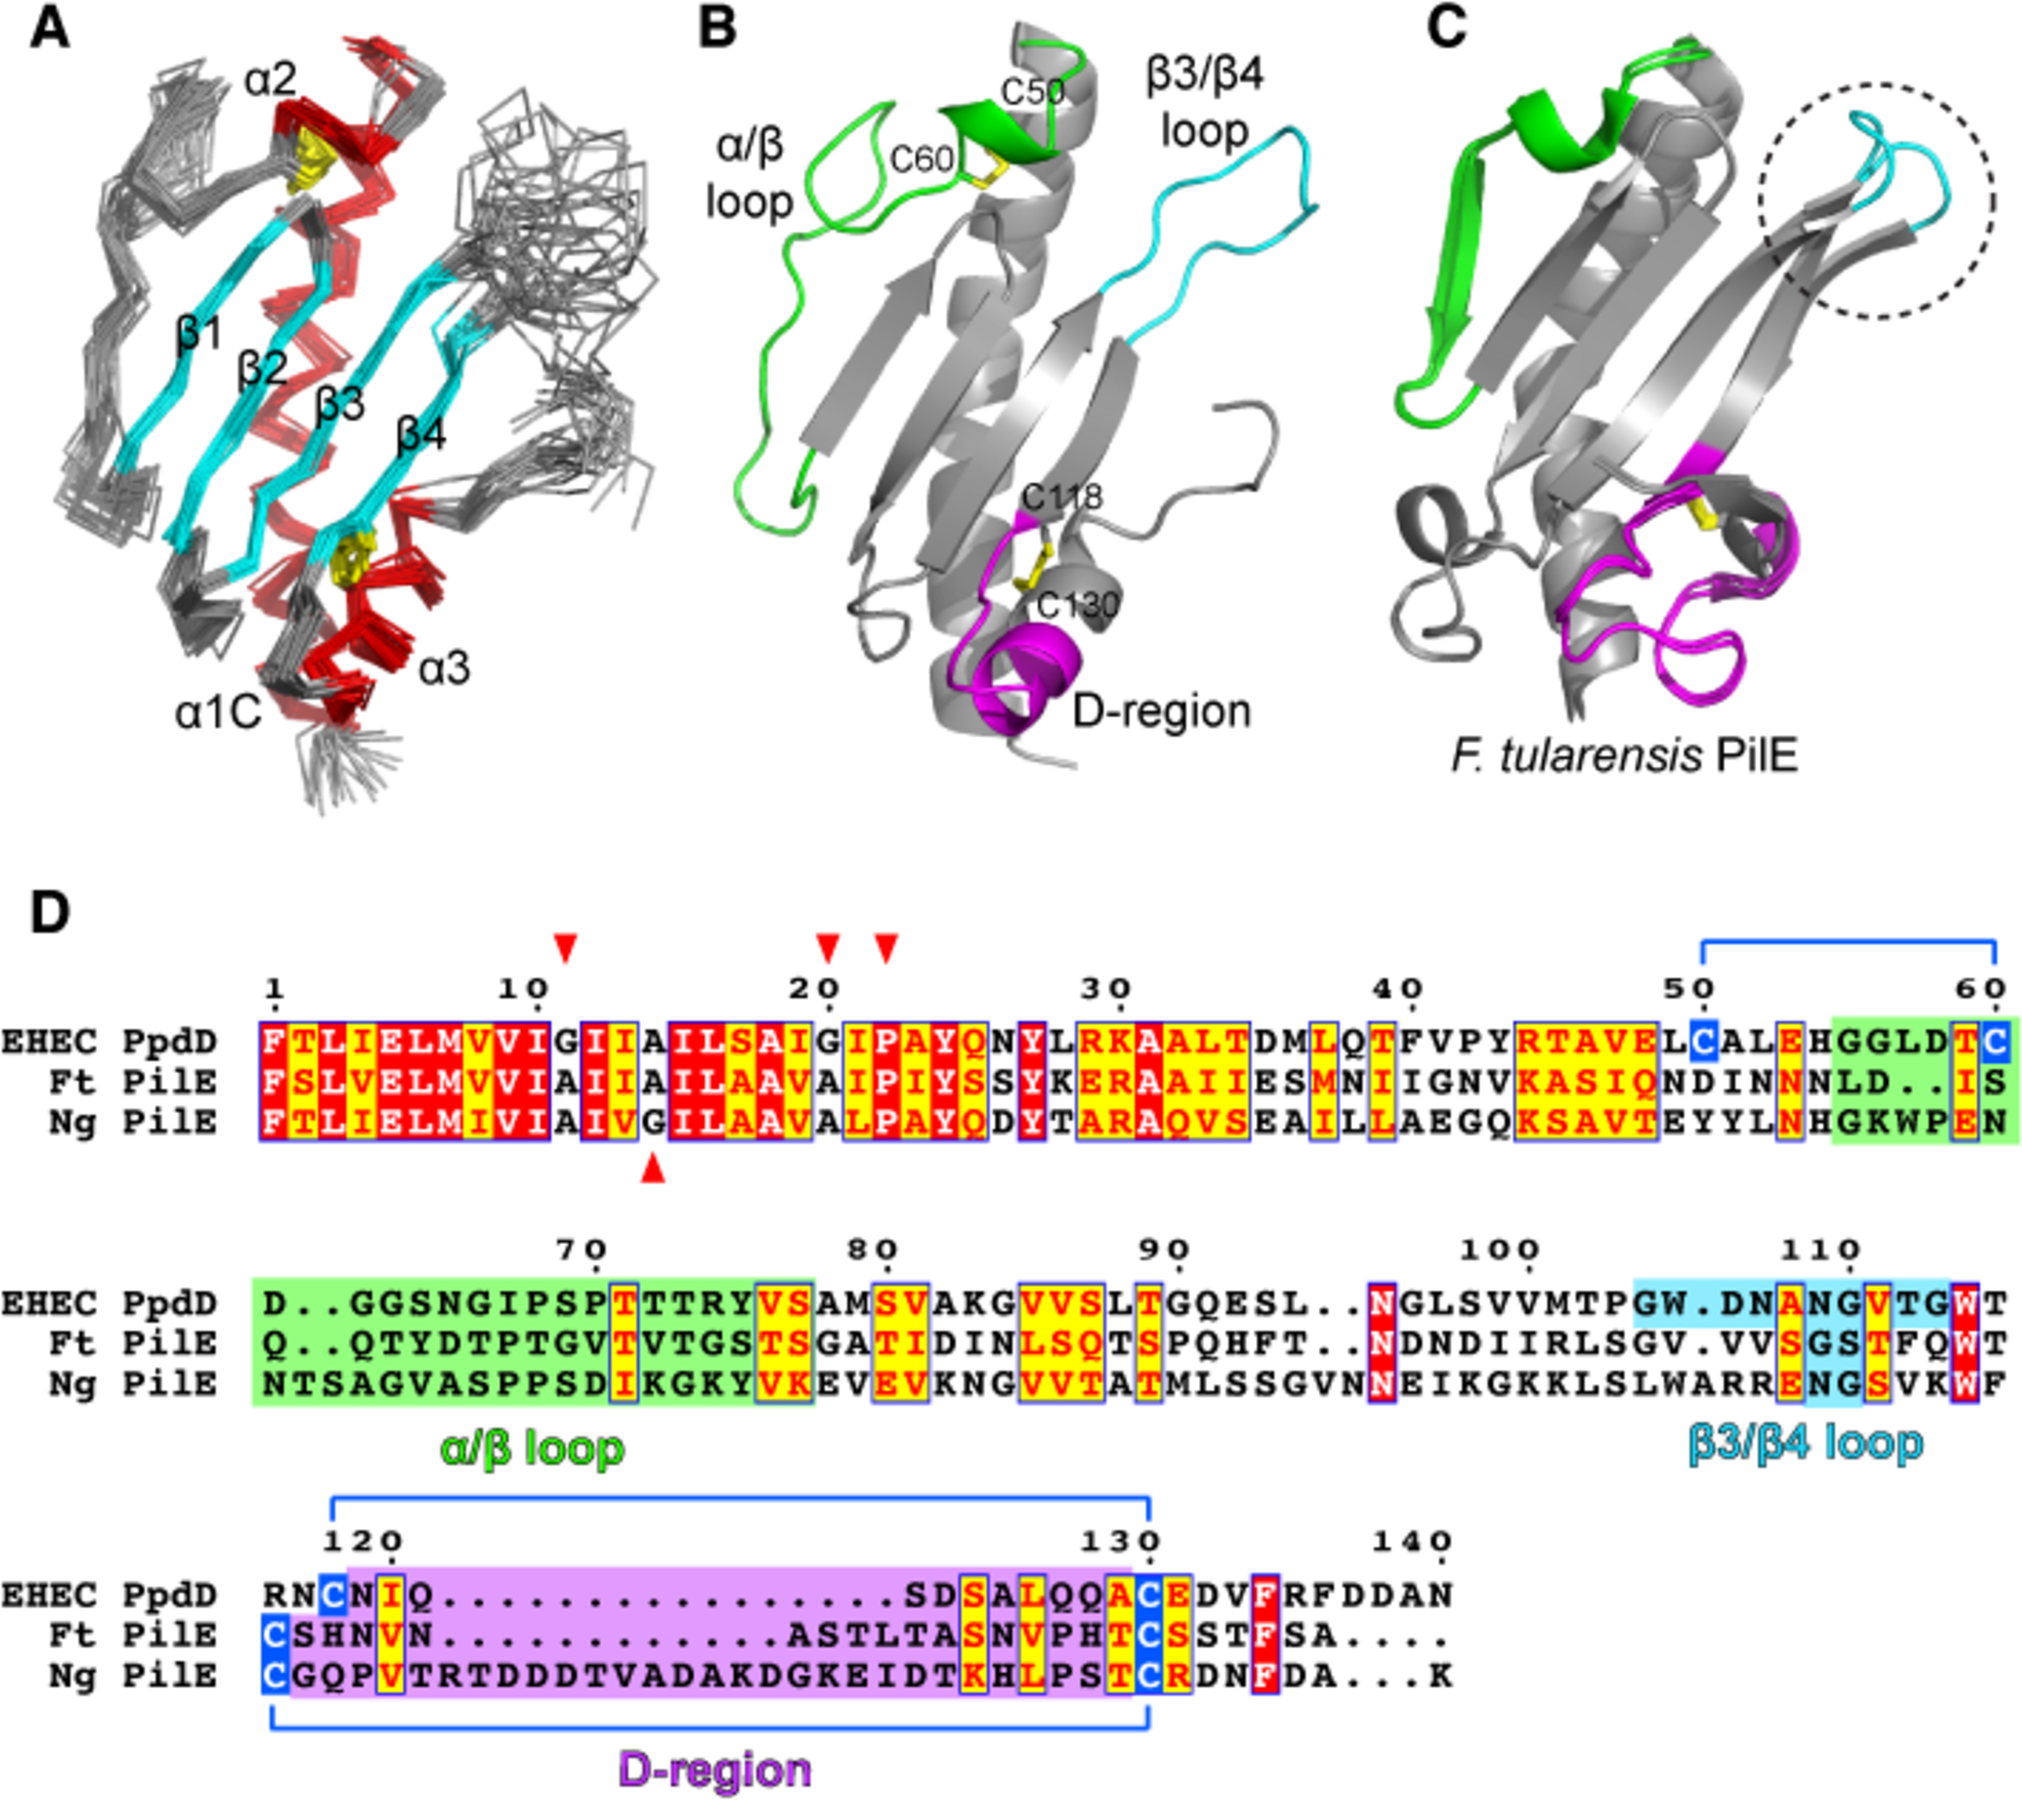
Figure 1. Solution NMR structure of PpdDp.

(A) Backbone representation of the NMR ensemble of PpdDp colored by secondary structure elements. Helices α1C, α2 and α3 are shown in red and the β1-β2-β3-β4 sheet is shown in cyan. Disulfide bridges are colored in yellow. (B) Ribbon representation of the lowest energy model of the PpdDp NMR ensemble. Characteristic hypervariable regions in T4a major pilins are colored as follows: α/β loop in green, β3/β4 loop in cyan and D-region in magenta. Disulfide bridges C50-C60 and C118-C130 are shown as yellow sticks. (C) Superposition of the two molecules in the asymmetric unit of the Francisella tularensis PilE crystallographic structure (PDB 3SOJ). Hypervariable regions are colored as in (B). The conformationally variable β3/β4 loop is highlighted by a dotted circle. (D) Sequence alignment of full-length PpdD from EHEC, PilE pilins from Francisella tularensis (Ft) and Neisseria gonorrhoeae (Ng). Positions of helix breaking residues (G, P) in the N-terminal region are highlighted with red arrows. Cysteine residues involved in disulfide bridges are connected by blue lines.
