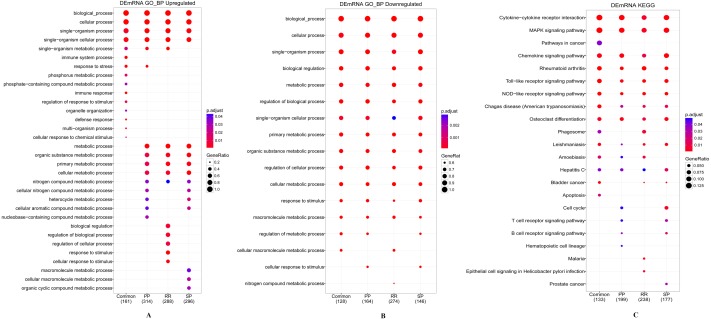
Figure 2. Enrichment analysis results of GO and KEGG.
(A) Biological processes analysis of up-regulated DEGs of three MS stages and their common DEGs. (B) Biological processes analysis of down-regulated DEGs of three MS stages and their common DEGs. (C) KEGG pathway analysis of DEGs. The number of genes has the annotation for each set presented in brackets.

