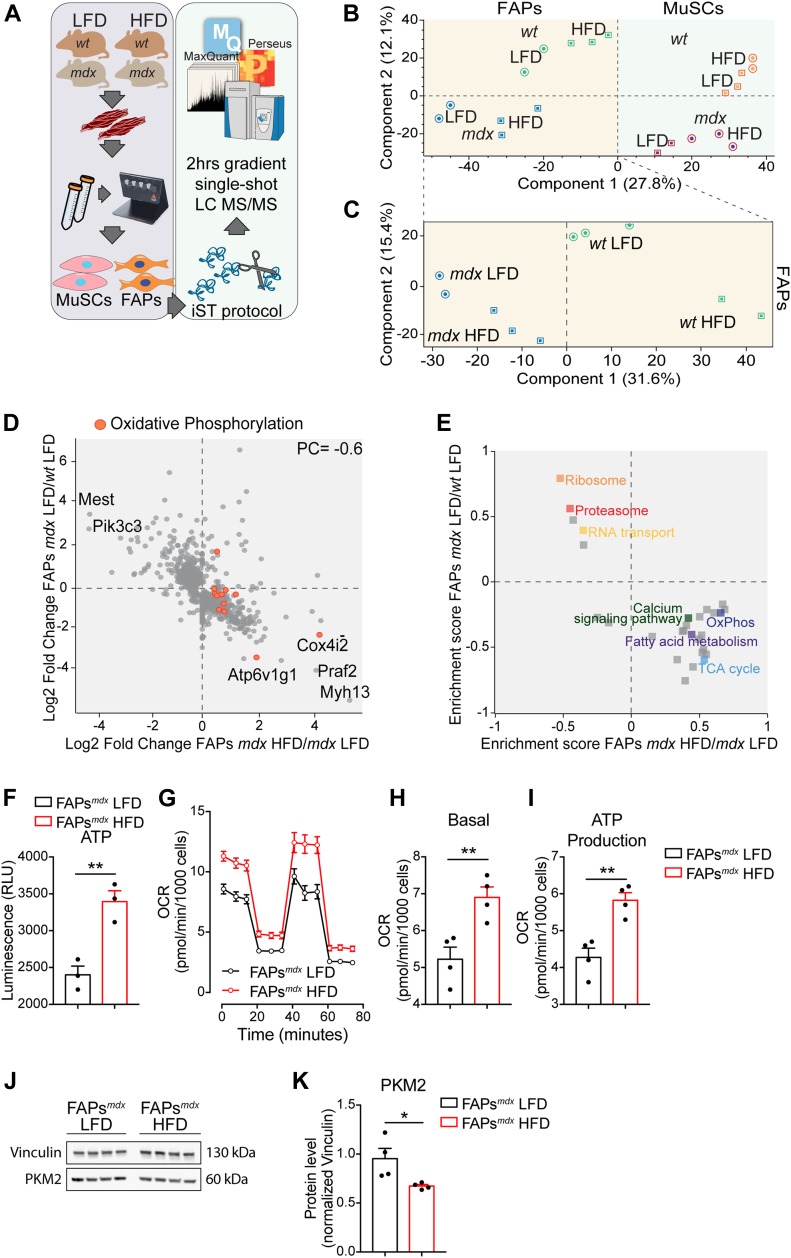
Figure 3. Short-term high-fat diet (HFD) rewires the metabolic signature of dystrophic fibro/adipogenic progenitors (FAPs).
(A) Experimental workflow to analyze the proteome of FAPs and Muscle Satellite Cells purified from 49-d-old wt and mdx mice fed with low-fat diet (LFD) and HFD (wt LFD n = 3; wt HFD n = 2; mdx LFD n = 2; mdx HFD n = 3). (B) Principal component analysis of the proteomic profiles of FAPs and muscle satellite cells from mice under LFD or HFD. (C) The principal component analysis inset shows the sample separation of wt/mdx FAPs from mice fed with LFD and HFD. (D) Scatterplot of the log2 fold change of protein expression level of 480 proteins significantly modulated in mdx/wt FAPs (y-axis) and HFD/LFD mdx FAPs (x-axis). (E) Two-dimensional annotation enrichment analysis of the significantly modulated proteins in mdx/wt FAPs (y-axis) and HFD/LFD mdx FAPs (x-axis). Groups of related GO terms are labelled with the same color, as described in the inset. (F) Quantitation of the ATP in FAPs purified from 49-d-old mdx mice fed with LFD and HFD (n = 3). (G) Mitochondrial stress test profile of LFD and HFD mdx FAPs. Oxygen consumption rate (pmol/min/103 cells) was monitored in real time (for 80 min) under basal condition and upon sequential treatment with mitochondrial inhibitors (mdx LFD n = 4; mdx HFD n = 4). (H, I) Bar graphs representing basal oxygen consumption rate (H) and ATP production (I). (J, K) Western blot (J) and relative densitometric analysis (K) of PKM2 and vinculin in FAPs from mdx mice fed with LFD and HFD (mdx LFD n = 4; mdx HFD n = 4). Statistical significance was estimated by t test. All data are represented as mean ± SEM and statistical significance is defined as *P < 0.05; **P < 0.01; ***P < 0.001.

