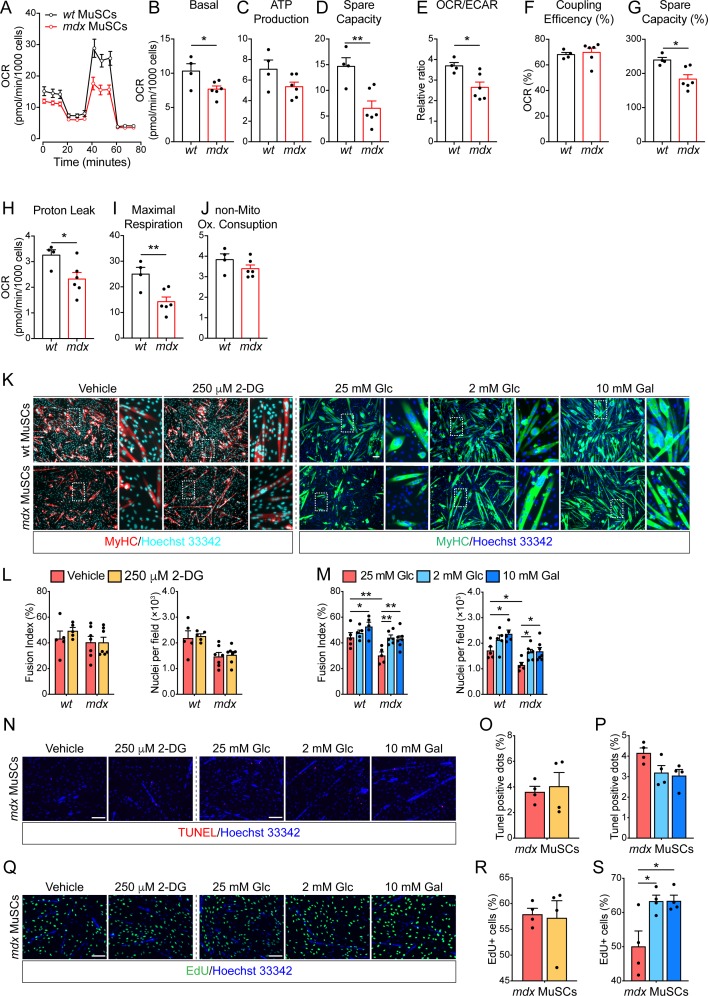
Figure S2. Dystrophic muscle satellite cells (MuSCs) share common mitochondrial defects with mdx fibro/adipogenic Progenitors. MuSC differentiation can be modulated by metabolic interventions. Referred to Fig 2.
(A). Mitochondrial stress test profile of wt and mdx MuSCs (from 45-d-old wt and mdx mice). Oxygen consumption rate (OCR) (pmol/min/103 cells) monitored in real time (for 80 min) under basal conditions and upon sequential treatment with mitochondrial inhibitors (wt n = 4; mdx n = 6). (B, C, D, E, F, G, H, I, J) Bar graphs representing the basal OCR (B), ATP production (C), spare capacity (D), OCR/Extra-Cellular Acidification Rate ratio (E), percentage of coupling efficiency (F), percentage of spare respiratory capacity (G), proton leak (H), and maximal respiration (I) non-mitochondrial oxygen consumption (J). Statistical significance was estimated by t test. (K) Representative MyHC immunostaining (10× magnification; scale bar, 100 μm) of wt and mdx MuSC-derived myotubes (from 45-d old mice) upon incubation with DMSO (vehicle), 250 μm 2-DG, 25 mM Glc alone, 2 mM Glc, or 10 mM Gal. Nuclei (blue) were counterstained with Hoechst 33342. (L) Bar plots showing the fusion index and the average number of nuclei per field of MuSCs differentiated in the presence of vehicle and 250 μM 2-DG (wt MuSCs n = 5; mdx MuSCs n = 7). (M) Bar plots showing the fusion index and the average number of nuclei per field of MuSCs differentiated in the presence of 25 mM Glc, 2 mM Glc, or 10 mM Gal (wt MuSCs n = 5; mdx MuSCs 25 mM Glc n = 5; mdx MuSCs 2 mM Glc n = 6; mdx MuSCs 10 mM Gal n = 7). Statistical significance was estimated by two-way ANOVA. (N) Representative TUNEL immunofluorescence showing pyknotic nuclear dots (red) in mdx MuSCs (from 45-d-old mice) incubated in the presence of DMSO (vehicle), 250 μm 2-DG, 25 mM Glc alone, 2 mM Glc, or 10 mM Gal. Nuclei (blue) were counterstained with Hoechst 33342. (O) Bar plot showing the percentage of pyknotic nuclear dots (TUNEL+ dots) in mdx MuSCs incubated in the presence of DMSO (vehicle) or 250 μm 2-DG (n = 4). Statistical significance was estimated by t test. (P) Bar plot showing the percentage of pyknotic nuclear dots (TUNEL+ dots) in mdx MuSCs incubated in the presence of 25 mM Glc, 2 mM Glc, or 10 mM Gal (n = 4). Statistical significance was estimated by one-way ANOVA. (Q) Representative EdU labelling showing proliferating mdx MuSCs (green) (from 45-d-old mice) incubated in the presence of DMSO (vehicle), 250 μm 2-DG, 25 mM Glc alone, 2 mM Glc, or 10 mM Gal. Nuclei (blue) were counterstained with Hoechst 33342. (R) Bar plot showing the percentage of EdU+ mdx MuSCs upon incubation with DMSO (vehicle) or 250 μm 2-DG (n = 4). Statistical significance was estimated by t test. (S) Bar plot showing the percentage of EdU+ mdx MuSCs upon incubation with 25 mM Glc, 2 mM Glc, or 10 mM Gal (n = 4). Statistical significance was estimated by one-way ANOVA. All data are represented as mean ± SEM and statistical significance is defined as *P < 0.05; **P < 0.01; ***P < 0.001.

