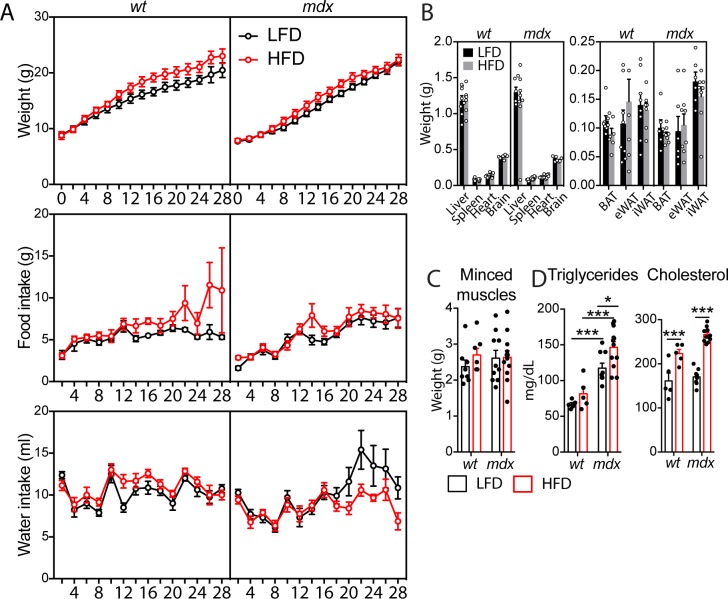
Figure S4. Short-term high-fat diet (HFD) of wt and mdx mice. Referred to Fig 3.
(A) Weight (grams, g), food (g), and water (milliliters, ml) intake in 49-d-old wt and mdx mice were recorded every 2 d during the diet period. (B) Bar plot (left) reporting the organ weight for the liver, spleen, heart, and brain of 49-d-old wt and mdx mice fed with low-fat diet (LFD) or HFD. Bar plot (right) reporting the weight of adipose depots BAT, brown adipose tissue; eWAT, epididymal adipose tissue; iWAT, inguinal adipose tissue explanted from wt and mdx mice fed with LFD or HFD (wt LFD n = 8 mice; wt HFD n = 7 mice; mdx LFD n = 6 mice; mdx HFD n = 8 mice). (C) Box plot reporting the weight of the minced muscle tissue before the enzymatic digestion for each condition (wt LFD n = 8 mice; wt HFD n = 7 mice; mdx LFD n = 10 mice; mdx HFD n = 12 mice). (D) Serum levels of triglycerides and cholesterol (milligrams per deciliter, mg/dl) from wt and mdx mice fed with LFD and HFD (wt LFD n = 5 mice; wt HFD n = 5 mice; mdx LFD n = 9 mice; mdx HFD n = 12 mice). Statistical significance was estimated by Two-way ANOVA. All data are represented as mean ± SEM and statistical significance is defined as *P < 0.05; **P < 0.01; ***P < 0.001.

